
Figure 4.
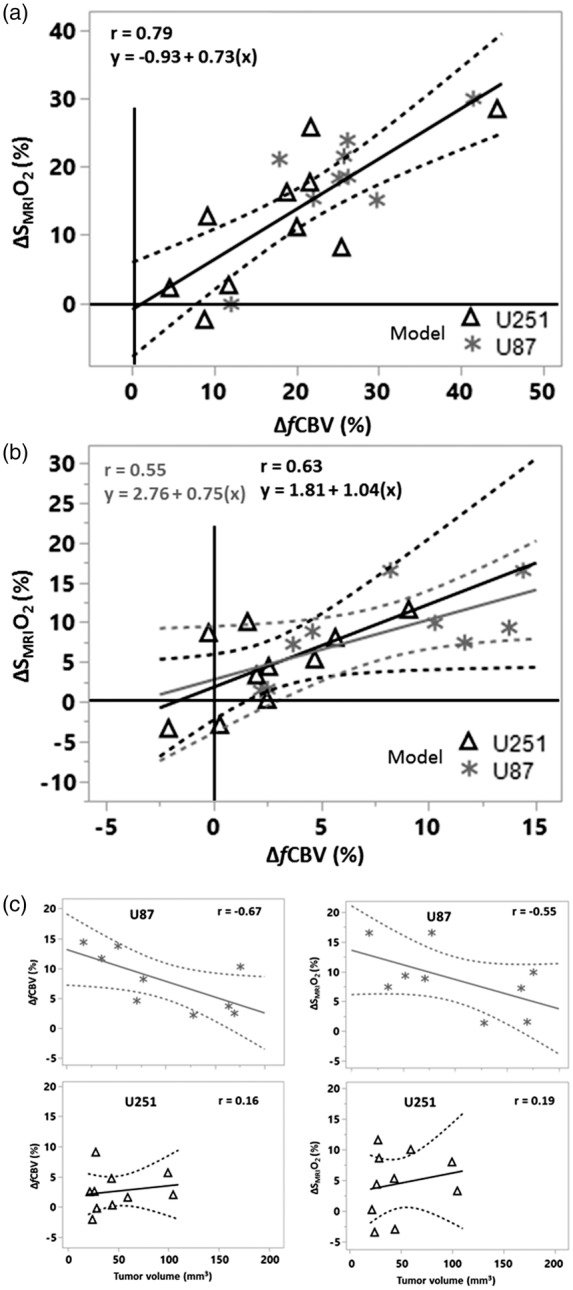
Carbogen-induced changes in the tissues explored. (a) Contralateral tissue; (b) Tumor. Note the changes in the x and y axes between (a) and (b). When the data shown in a and b are combined (n = 38), the following linear regression was found: ΔSMRIO2 (%) = 0.63 ΔfCBV + 2.39 (r = 0.81, p < 0.001, figure not illustrated). (c) ΔfCBV and ΔSMRIO2 as a function of tumor volume. The linear regressions are represented in solid lines, with the interval of confidence in dashed lines.