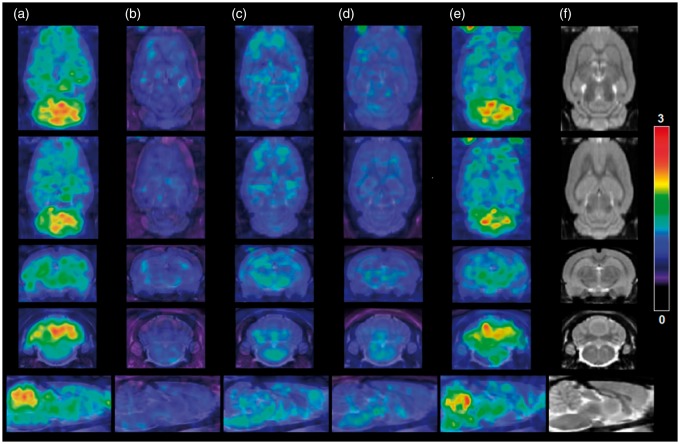
Figure 3.
PET and CT images of normal SD rat brains. PET images of [18F]cEFQ (a), [18F]tEFQ (b), [18F]cEFQ 10 min after pretreatment with 3 mg/kg cEFQ (c), [18F]cEFQ 10 min after pretreatment with 3 mg/kg JNJ16259685 (d), [18F]cEFQ 10 min after pretreatment with 3 mg/kg ABP688 (e) and CT image (f). All PET images are sum images of 2–10 min after injection.

