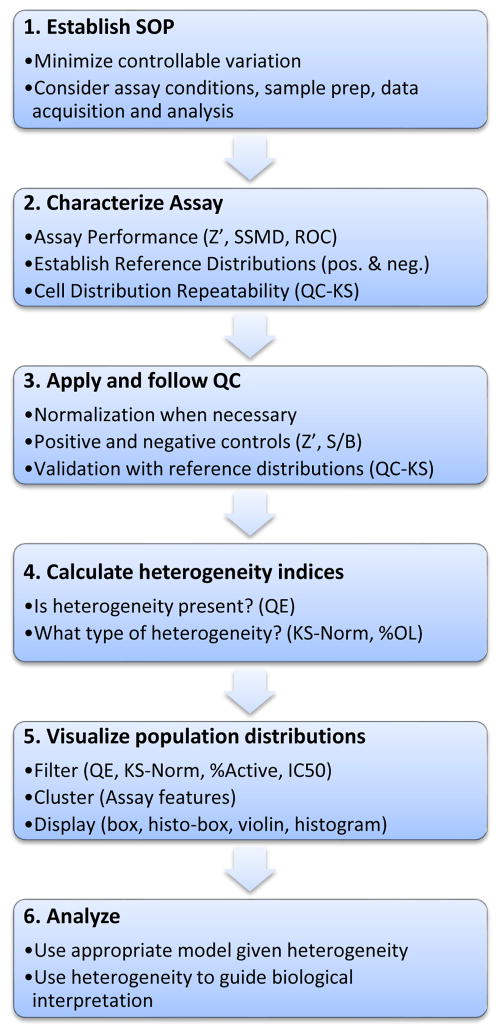
Figure 4. A workflow for quantitation of heterogeneity.
The quantitative analysis of biological heterogeneity requires assay validation and quality control similar to a screen, but with the addition of quality control methods and metrics for ensuring the reproducibility of the population distributions. After establishing the assay SOP (1), one approach is to establish a reference distribution while characterizing assay performance (2). The reference distribution is used throughout the project (3) to track the population distributions in the control wells. Once the consistency of the assay has been established, heterogeneity metrics can be applied to dissect the heterogeneity (4), and interactive analysis and visualization tools used to examine filtered or clustered distributions (5). Selected distributions can then be analyzed with various models and used to guide interpretations or drive the next experiments (6).

