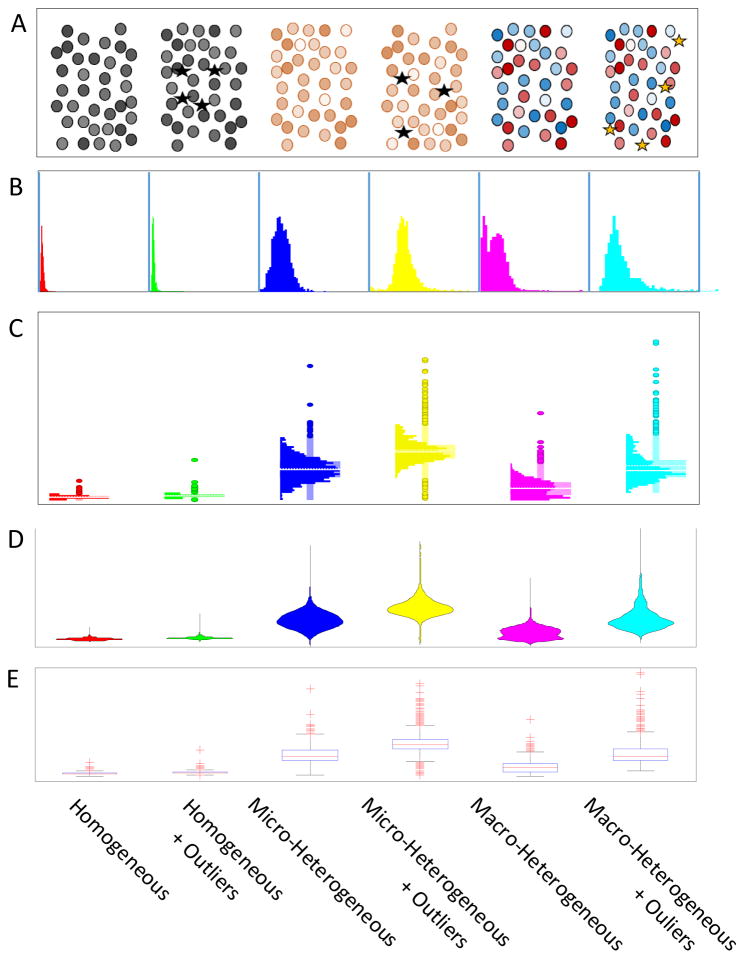
Figure 5.
Visualization of patterns of heterogeneity in population samples. Patterns are described based on six general classes of heterogeneity on the horizontal axis. A. Depiction of the various types of heterogeneity among cells as they might appear in an image. B. Histograms with outliers depicted as individual points based on a standard box plot (“Histo-box plot”4). C. Traditional histograms. D. “Violin plots”,139 essentially double sided histograms. E. A standard box plot.

