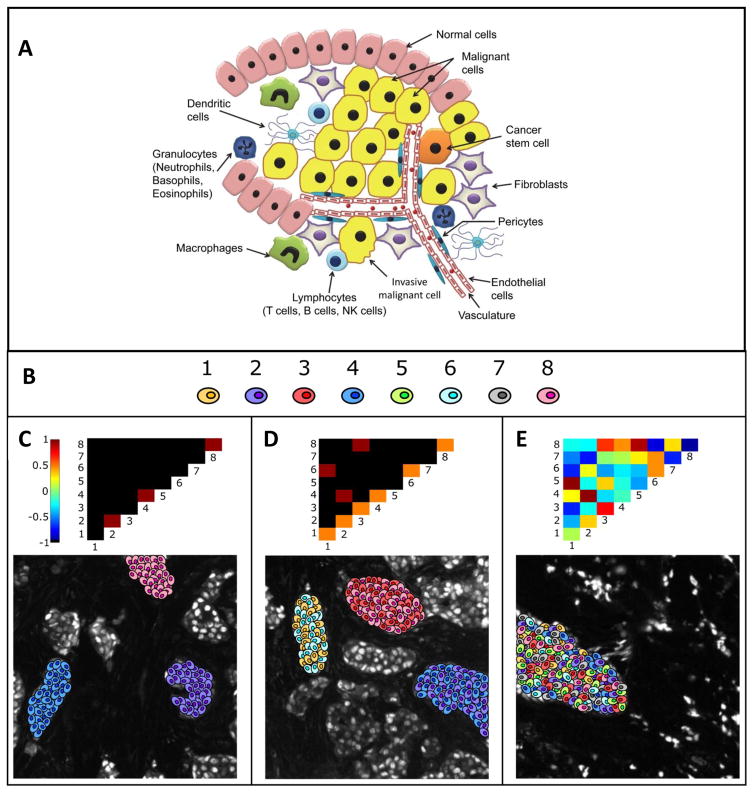
Fig. 7. Canonical pointwise mutual information (PMI) maps depicting various forms of spatial ITH.
A. Illustration of the heterogeneity in a tumor. B. Cartoon representation of 8 different cellular phenotypes based on high-dimensional biomarker intensity patterns acquired via pattern recognition algorithms C. A PMI map with strong diagonal entries and weak off-diagonal entries describes a globally heterogeneous but locally homogeneous tumor. In this example, the PMI map highlights locally homogeneous tumor microdomains containing cells of only one type each, phenotypes 2, 4, and 8 respectively. D. On the contrary, a PMI map with strong off-diagonal entries describes a tumor that is locally heterogeneous. In this example, locally heterogeneous tumor microdomains exist, as portrayed by the off-diagonal entries. One domain contains phenotypes 1 and 5, another contains phenotypes 2 and 4, and yet another containing phenotypes 3 and 8. E. PMI maps can also portray anti-associations (e.g., if phenotype 1 never occurs spatially near phenotype 3). The ensemble of associations and anti-associations of varying intensities along or off the diagonal represent the true complexity of tumor images in a format that can be summarized and interrogated. In this example, changing the distance threshold used in the PMI calculations have minor effects on the results. While Increasing the distance tends to promote positive associations and decreasing the distance tends to increase negative associations, the effects are not significant and the overall conclusions regarding the heterogeneity remain the same. Figures B–E reprinted with permission from Spagnolo et al.21

