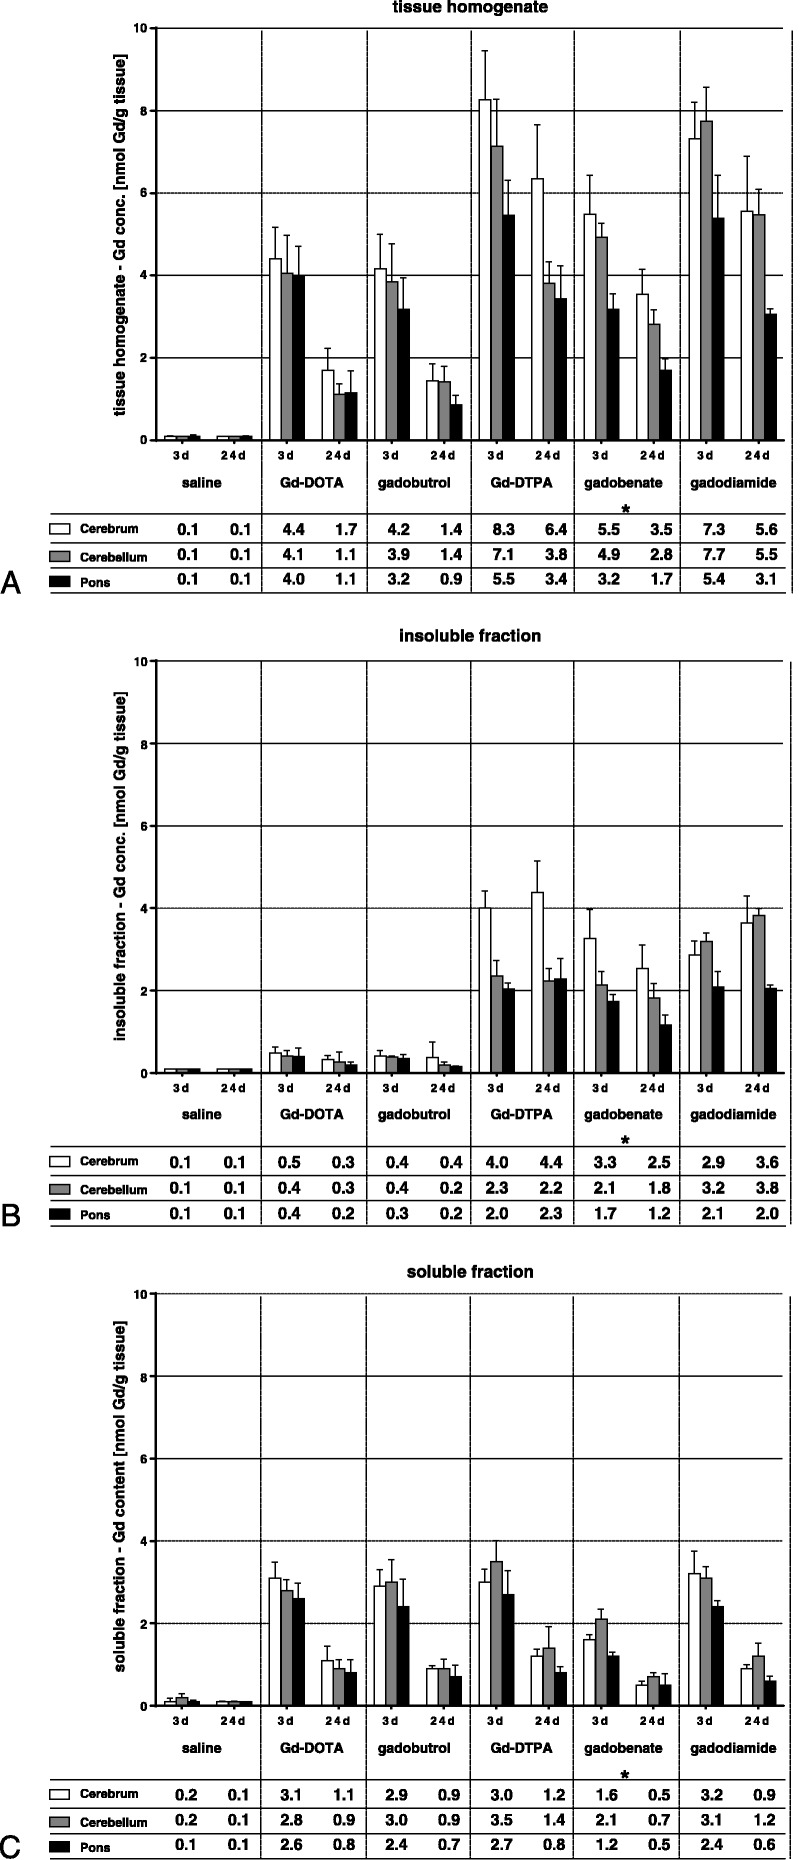
FIGURE 3.

Total gadolinium concentrations (in nmol Gd/g tissue) in the tissue homogenates (A) of the 3 brain, sections cerebrum, cerebellum, and pons, measured 3 and 24 days after the last injection and in the insoluble (B) and soluble (C) fractions. The tables show the mean of 5 animals. The SD is shown in the error bars. Asterisk indicates faster elimination of gadobenate likely due to additional hepatobiliary excretion of ~50% in rats, which accounts for only 3% to 5% in humans.31,32
