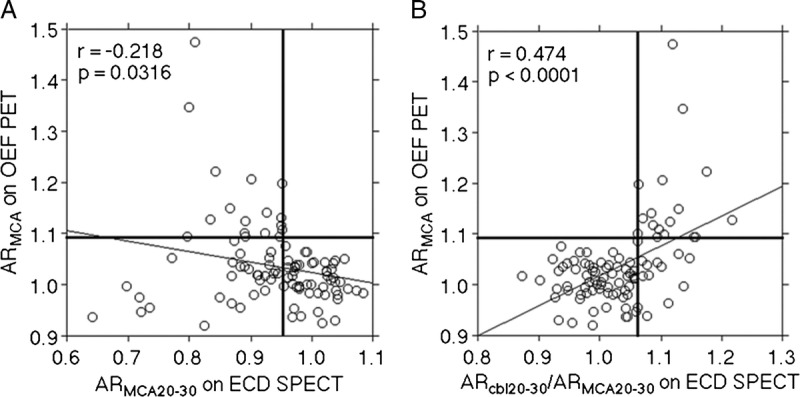
FIGURE 3.

Correlation between ARMCA on OEF PET and ARMCA20–30 (A) or ARcbl20–30/ARMCA20–30 (B) on 99mTc-ECD SPECT in patients. The horizontal line denotes mean ± 2 SDs for ARMCA on OEF PET obtained in healthy volunteers (a patient value greater than this line is defined as an abnormally elevated ARMCA on OEF PET). The vertical line denotes the cutoff point that is closest to the left upper corner of the ROC curve for detecting abnormally elevated ARMCA on OEF PET in patients. The solid line (y = −0.203x ± 1.226 for A; y = 0.584x ± 0.434 for B) denotes the regression line of patients. Each circle represents 1 patient.
