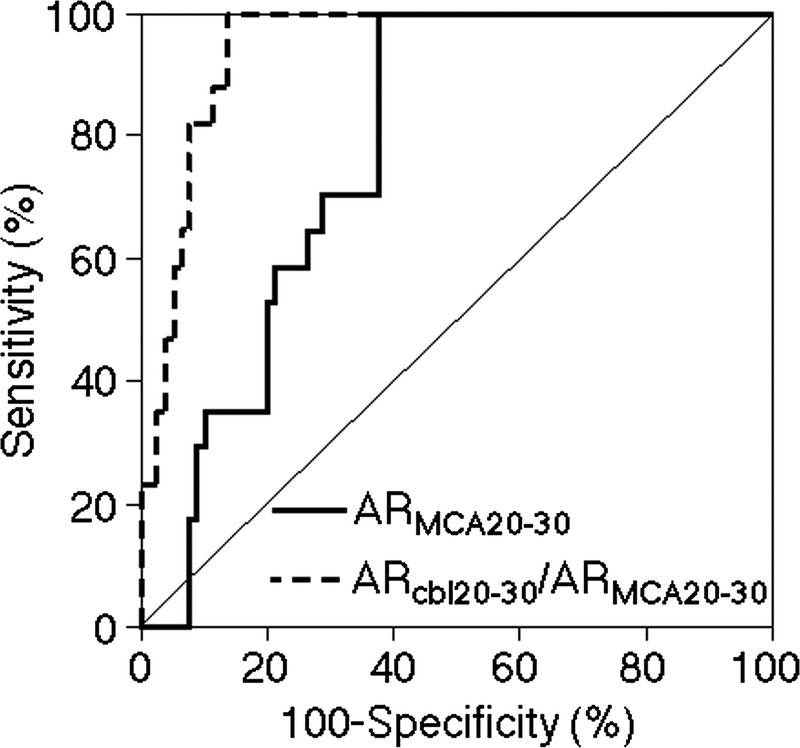
FIGURE 4.

Receiver operating characteristic curves used to compare accuracy between ARMCA20–30 and ARcbl20–30/ARMCA20–30 on 99mTc-ECD SPECT for detecting abnormally elevated ARMCA on OEF PET in patients. The area under the ROC curve is significantly greater for ARcbl20–30/ARMCA20–30 than for ARMCA20–30 (difference between areas, 0.167; P = 0.0001).
