. 2017 Jun 8;6:e22593. doi: 10.7554/eLife.22593

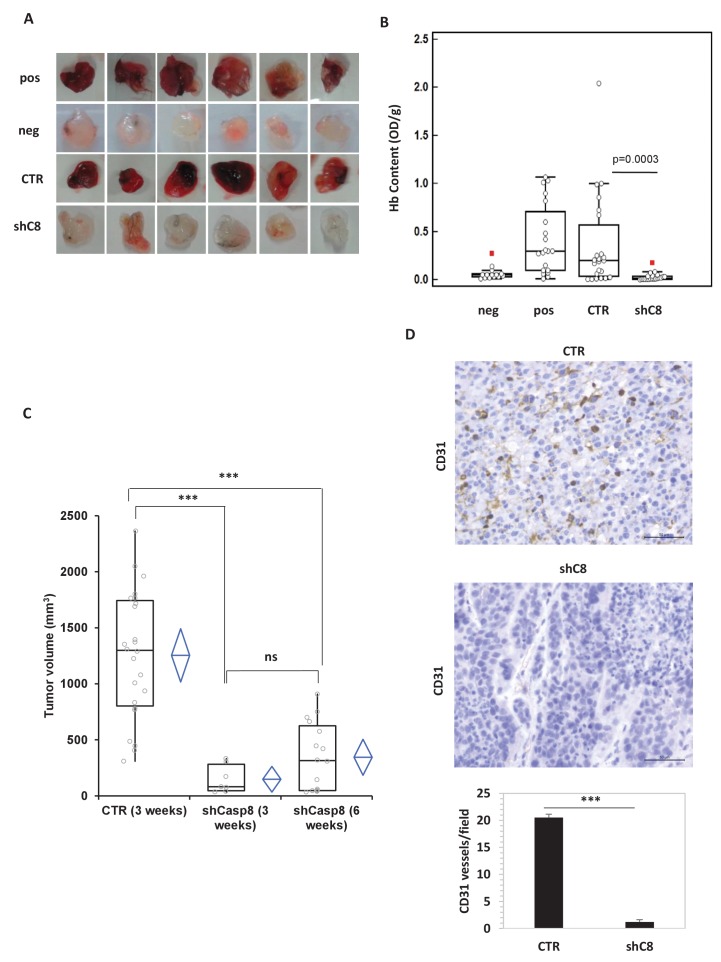
Figure 1. Caspase-8 expression promotes tumor growth and neoangiogenesis in vitro and in vivo.

(A, B) Caspase-8 expression promotes the ability of conditioned medium (CM) from U87 cells to induce neo-angiogenesis in vivo. Representative images illustrate the macroscopic analysis (A) and quantification of Hb content (B) of Matrigel plugs containing CM from Sh Control (CTR, n = 23) or Sh Caspase-8 (ShC8, n = 21) cells. The negative (Neg, n = 14) and positive (Pos, n = 20) controls contained heparin alone or heparin plus VEGF, respectively. The values of biological replicates (n) for each condition are shown as single dot, and are expressed as optical density (OD 540 nm)/g of the Matrigel plug. The Mann-Whitney test (independent samples) was used for statistical analyses. In all experiments, the volume of CM from different samples was normalized on the number of cells for each sample counted when CM was collected. (C) Comparison of the tumor size between U87 CTR and U87shC8 mouse xenografts. Quantitative analysis, by Kruskal-Wallis test with Bonferroni correction, of the volume of tumors measured at 3 and 6 weeks after cell injection. Each plot graphically shows the central location and scatter/dispersion of the values of each group: the line series in the rectangular-shaped boxes indicate the median value of the data and the end of the vertical lines indicate the minimum and the maximum data value. The means and their confidence intervals are shown in the diamond-shaped box. P-value was calculated according to the independent samples t-test. Each dot corresponds to the tumor value of one mouse. ***p<0.001. (D) The microvessel density, determined immunohistochemically by the means of an anti-CD31 antibody recognizing murine endothelial cells, evidenced the presence of a significantly higher number of vessels in CTR cells (evaluated as mean ± SD in CTR tumors) than in shC8 tumors (***p<0.001). Original magnification 40X, scale bar 50 µm.

DOI: http://dx.doi.org/10.7554/eLife.22593.003

Figure 1—source data 1. Caspase-8 mRNA is efficiently silenced in shC8 and shC8#2 cell lines compared to CTR cells.
Statistical analysis of quantitative real time RT-PCR Figure 1—figure supplement 1A.
DOI: 10.7554/eLife.22593.004
Figure 1—source data 2. Caspase-8 expression promotes the ability of conditioned medium (CM) from U87 cells to induce neo-angiogenesis .
Figure 1B Statistical analysis of the quantification of Hb content (Figure 1—figure supplement 2A, C). Statistical analysis of the quantification of HUVEC cells proliferation and of tubulogenesis.
DOI: 10.7554/eLife.22593.005
Figure 1—source data 3. Caspase-8 expression promotes tumor growth in mouse xenograft experiments.
Statistical analysis of tumor growth data from U87 and U87shC8 samples.
DOI: 10.7554/eLife.22593.006
Figure 1—source data 4. Caspase-8 expression promotes neovascularization in vivo.
Statistical analysis of vessel content analysis from immunohystochemistry experiments (Figure 1D).
DOI: 10.7554/eLife.22593.007

Figure 1.

Figure 1—figure supplement 1. Caspase-8 mRNA and protein expression is efficiently silenced in shC8 and shC8#2 cell lines compared to CTR cells.
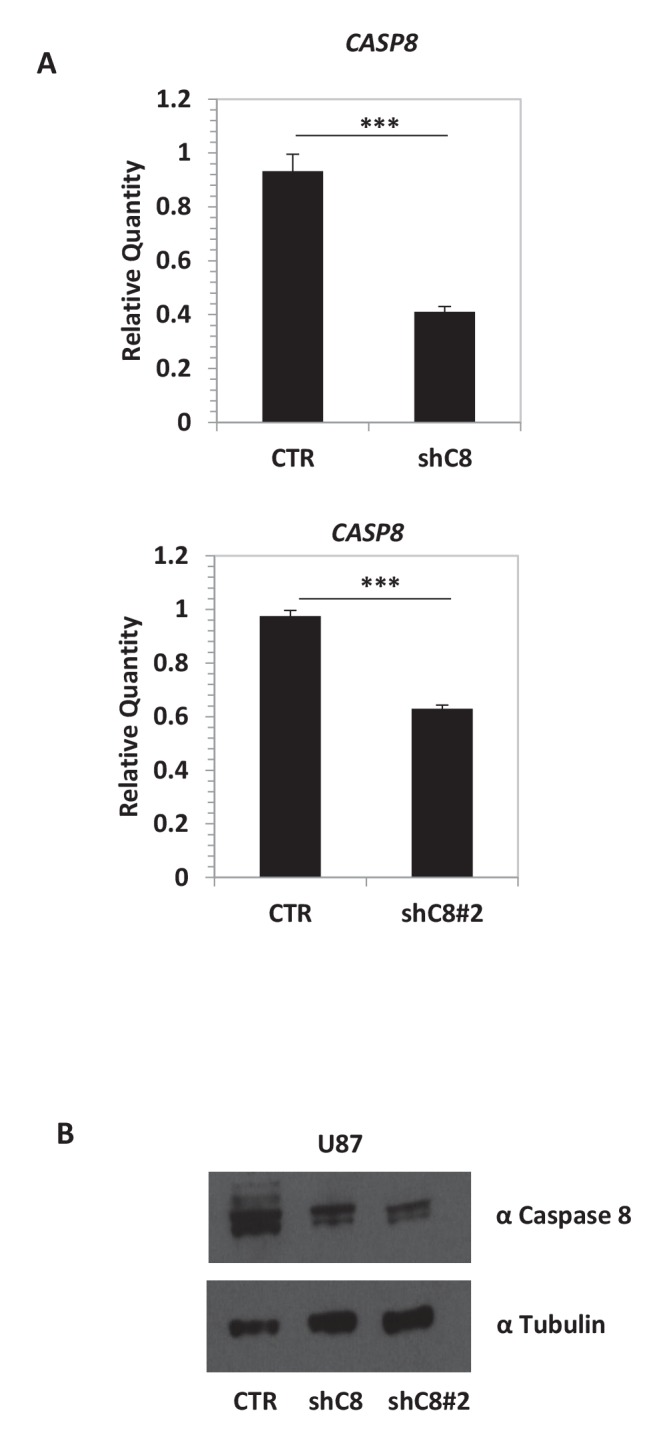
Figure 1—figure supplement 1.

(A) Quantitative real-time RT-PCR for Caspase-8 mRNA on U87CTR (CTR), U87shC8 (shC8) and U87shC8#2 (shC8#2) cells. Relative qQuantities were calculated by normalizing for TBP. Representative results of a single experiment with n = 3 biological replicates, each one performed in technical duplicate are shown as mean ± SD (***p<0.001). Three independent experiments were consistent. (B) Detection of Caspase-8 protein expression by western blot analysis of whole lysates of CTR, shC8 and shC8#2 cell lines.

Figure 1—figure supplement 2. Caspase-8 expression promotes the ability of conditioned medium from U87 cells to induce endothelial cells proliferation and Capillary Tube-Like Network Formation.
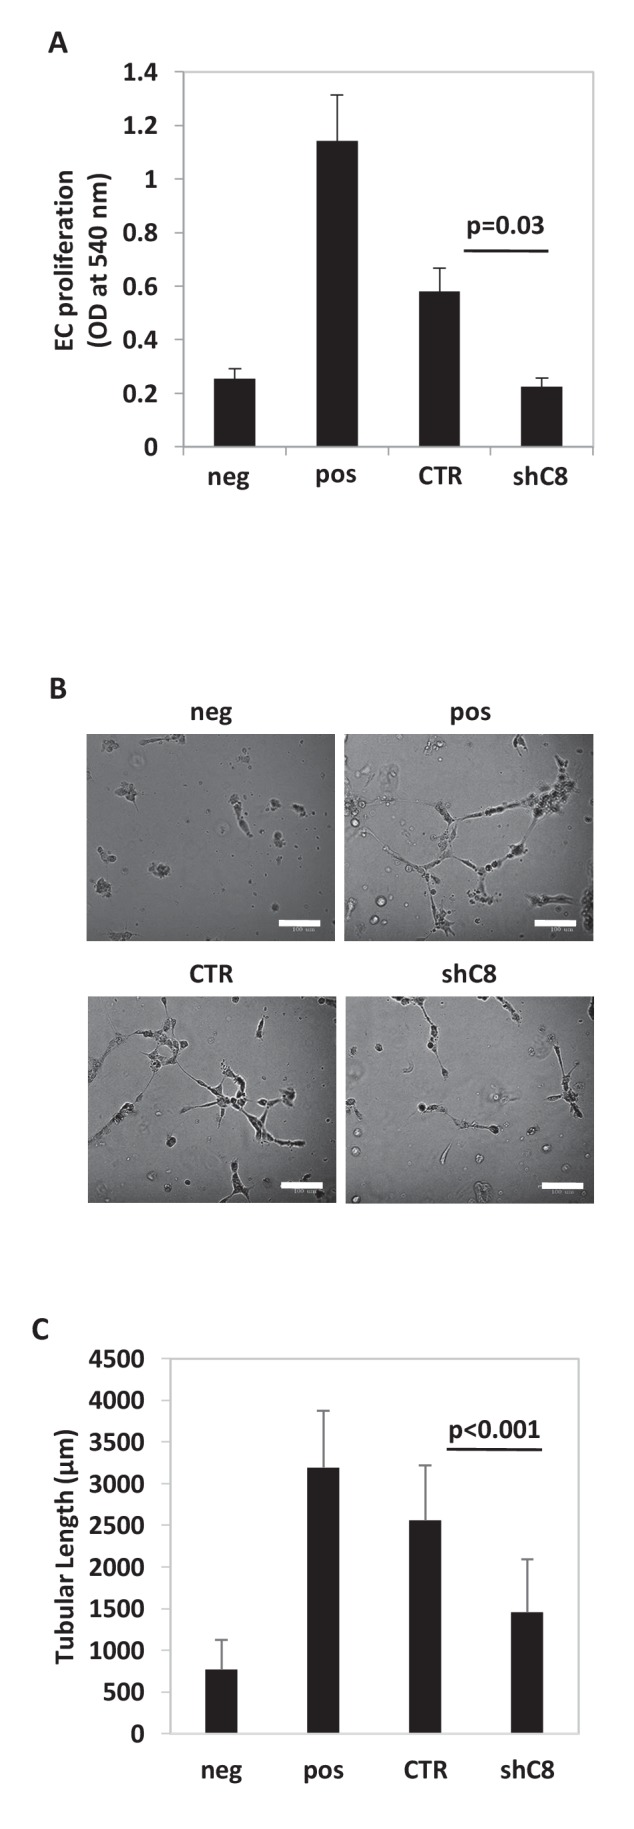
Figure 1—figure supplement 2.

(A) HUVEC proliferation evaluated after exposure for 72 hr to CM from Sh Control (CTR) or Sh Caspase-8 (ShC8) cells. Endothelial cells incubated in serum free medium (neg) or complete medium (pos) were used as negative or positive control, respectively. The results represent the mean ± SD. Error bars represent a SD between two independent experiments, each of them performed in six replicates. Student’s t test was used for statistical analyses. (B) Representative images of Capillary Tube-Like Network Formation Assay and quantification of sprouts formation, estimated by measuring the cumulative length of the sprouts (C), on Matrigel. Bar scale: 100 μm. Endothelial cells incubated in serum free medium (neg) or complete medium (pos) were used as negative or positive control, respectively. The values were expressed as mean of cumulative length of the sprouts ± SD. Error bars represent a SD among biological duplicates, with at least four technical replicates each, of a representative experiment. Student’s t test was used for statistical analyses. In all experiments, the volume of CM from different samples was normalized on the number on cells for each sample counted when CM was collected.