Figure 4. Downregulation of Caspase-8 increases sensibility to Temozolomide (TMZ).
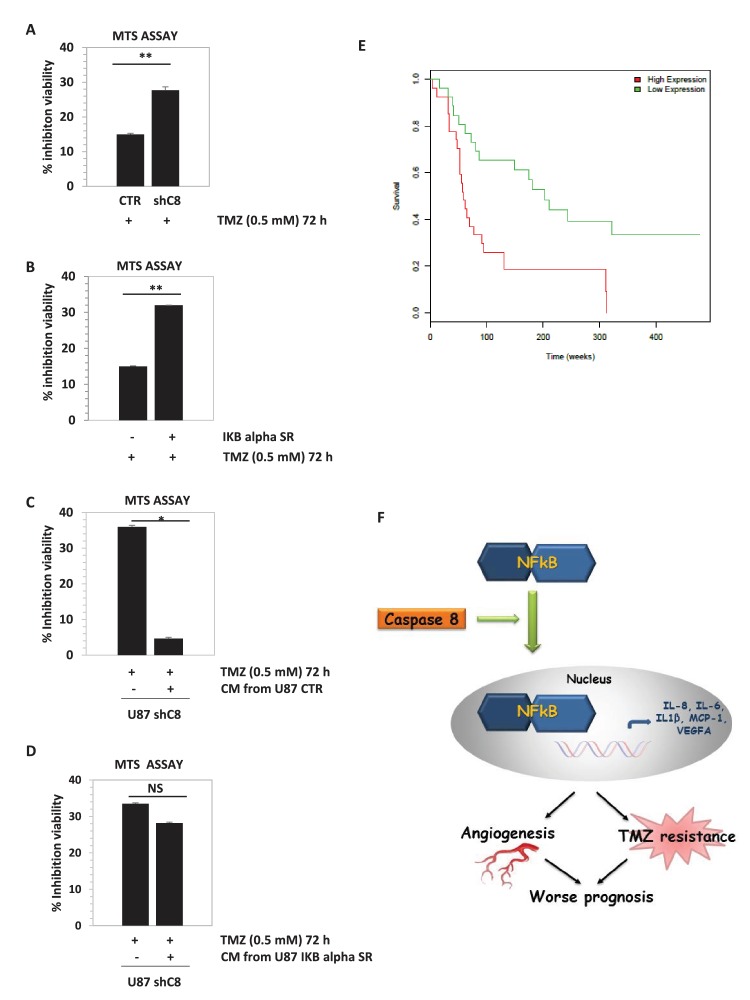
(A, B) Viability assay represented in the histogram as mean ± SD. U87CTR control cell lines, U87shCaspase-8 and U87 IKBalphaSR, were incubated in the presence of Temozolomide (TMZ 0.5 mM for 72 hr) or not. The viability of TMZ-treated cells was assessed with the CellTiter 96 Aqueous One Solution Cell proliferation assay, and was represented as the percentage of inhibition of viability measured in cells without TMZ treatment. Data are represented in the histogram as mean ± SD. Error bars represent a SD between three (A) or two (B) independent experiments, each of them performed at least in technical triplicate. Student’s t test was used for statistical analyses. **p<0.01 (A, B). (C, D) U87shCaspase-8 were incubated or not in the presence of Temozolomide (TMZ 0.5 mM for 72 hr) dissolved in conditioned media derived from U87 ShCtr (CTR), U87 shCaspase-8 (shC8) or U87IKBa SR. Data are represented in the histogram as mean ± SD. Error bars represent a SD between two (C) or three (D) independent experiments, each of them performed in technical triplicate. Student’s t test was used for statistical analyses. *p-value<0.05 (C), NS=not significant. In all experiments shown in panel A–D, the volume of CM from different samples was normalized on the number on cells for each sample counted when the CM was collected. (E) Survival curves of high-grade glioma classified based on Caspase-8 expression levels. Glioma patients were classified as low Caspase-8 expression (green curve) and high Caspase-8 expression level (red curve), as described in the text. The Kaplan-Meier test supports a significant difference (p-value 0.00117) between the survival rates of the two groups, with patients having a low Caspase-8 expression showing a higher survival probability. (F) Proposed model depicting the link between Caspase-8 and cytokines in glioblastoma. Caspase-8 promotes NFkB nuclear localization and sustains the production of VEGF, IL-6, IL-8, IL-1β and MCP-1. This pathway promotes neoangiogenesis and triggers resistance to Temozolomide.
DOI: http://dx.doi.org/10.7554/eLife.22593.021
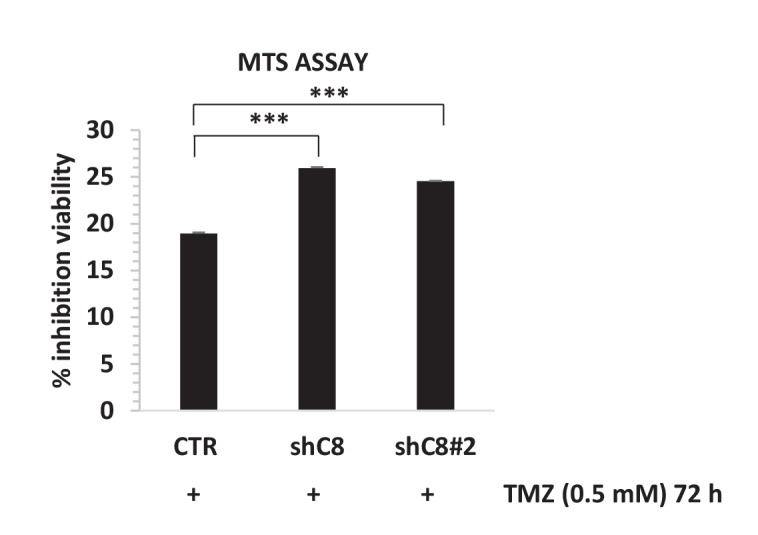
Figure 4—figure supplement 1. Caspase-8 downregulation by two independent interference sequences increases sensibility to Temozolomide (TMZ).

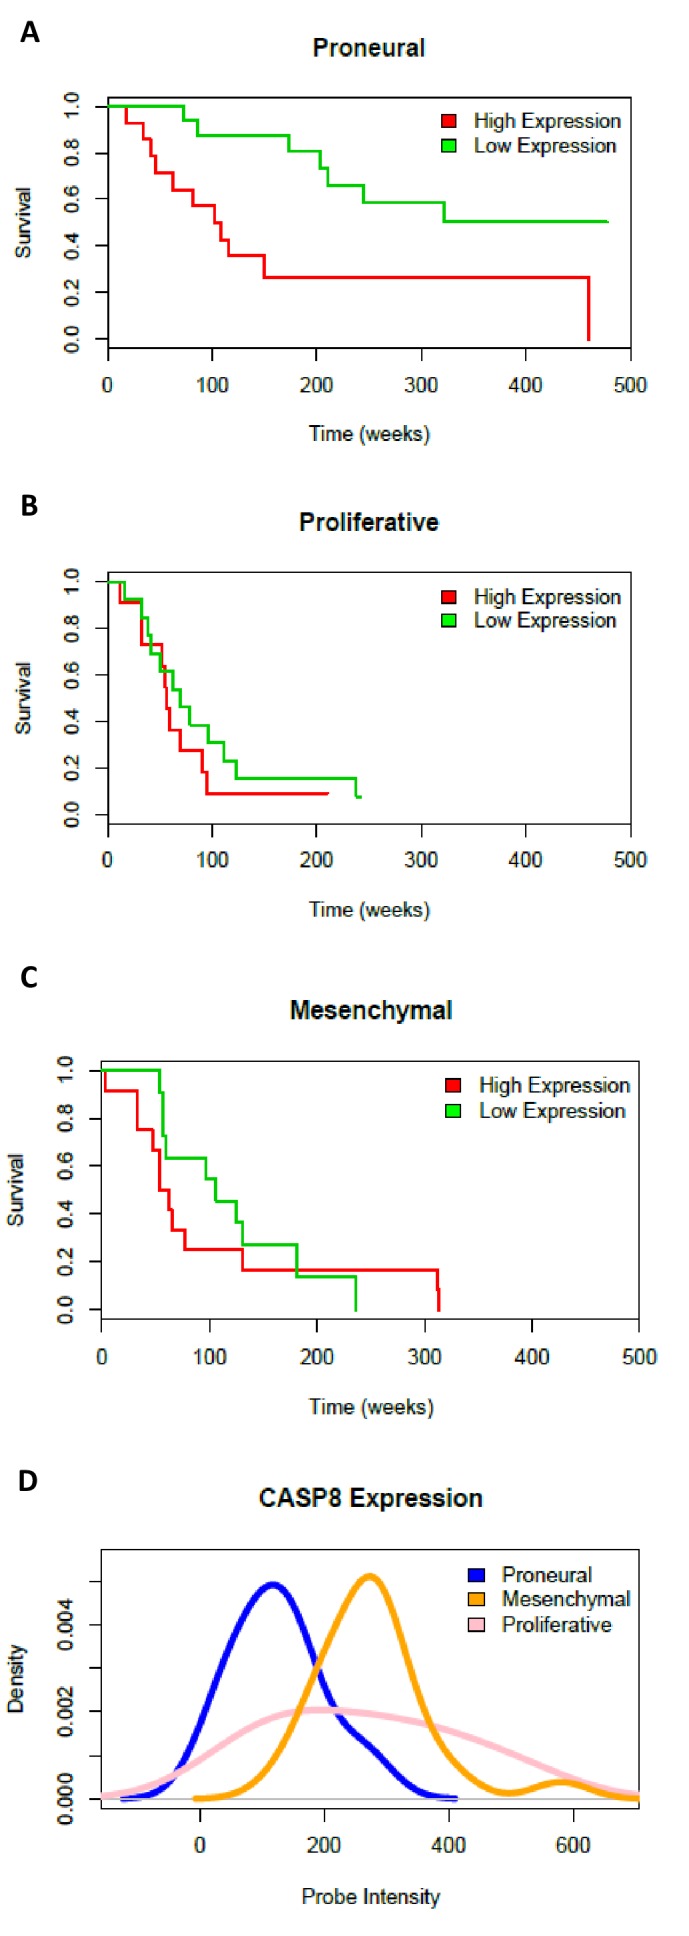
Figure 4—figure supplement 2. Survival curves and Caspase-8 expression levels in three GBM subtypes.


