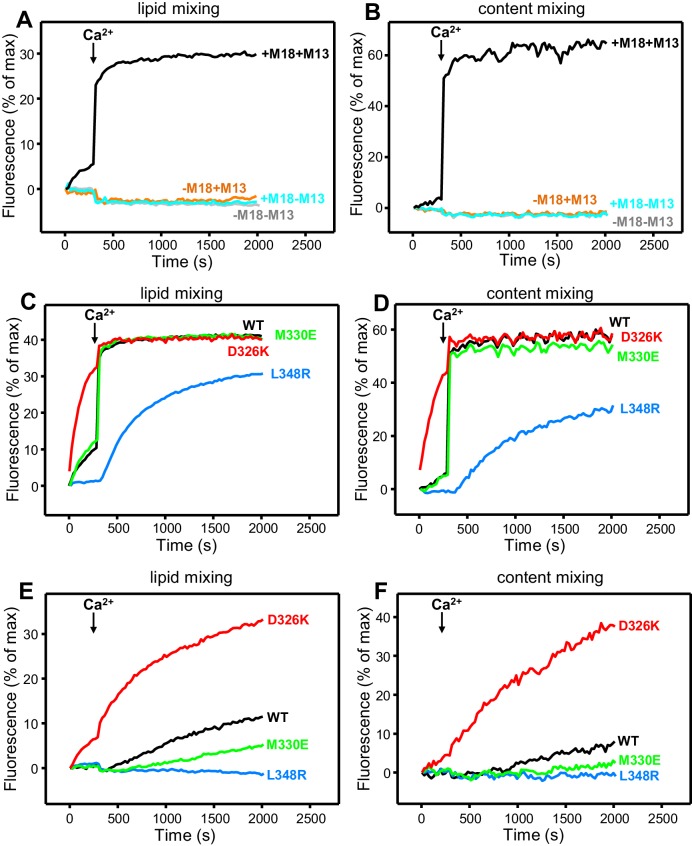
Figure 4. Effects of Munc18-1 mutations that alter synaptobrevin binding on membrane fusion in reconstitution assays.
Lipid mixing (A,C,E) between V- and T-liposomes was measured from the fluorescence de-quenching of Marina Blue-labeled lipids. Content mixing (B,D,F) was monitored from the development of FRET between PhycoE-Biotin trapped in the T-liposomes and Cy5-Streptavidin trapped in the V-liposomes. In (A,B), the assays were performed in the presence of NSF-αSNAP with or without WT Munc18-1 (M18) and/or Munc13-1 C1C2BMUNC2C (M13) as indicated. In (C,D), assays were performed in the presence of NSF-αSNAP, Munc13-1 C1C2BMUNC2C and WT or mutant Munc18-1s as indicated. In (E,F), assays were performed in the presence of NSF-αSNAP, synaptotagmin-1 C2AB fragment and WT or mutant Munc18-1s as indicated. Experiments were started in the presence of 100 μM EGTA and 5 µM streptavidin, and Ca2+ (600 μM) was added after 300 s.


