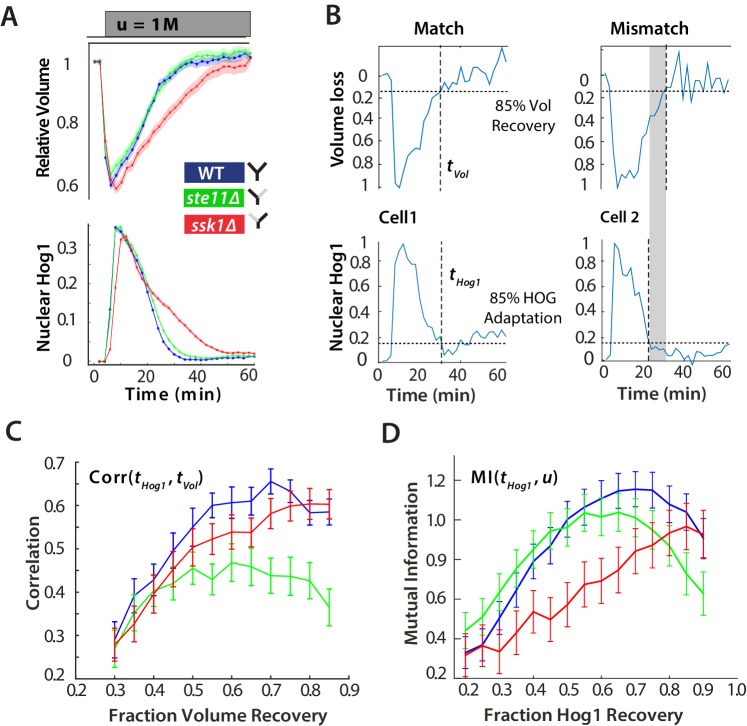
Figure 2. For hyperosmotic stress, accuracy can be quantified as the statistical dependency between the dynamics of Hog1 and the dynamics of volume recovery.
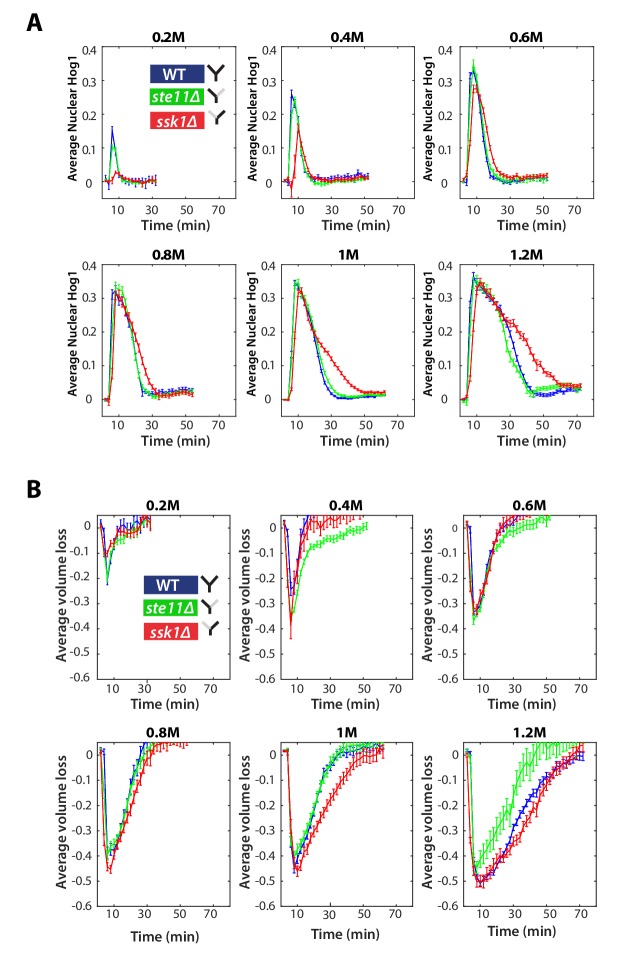
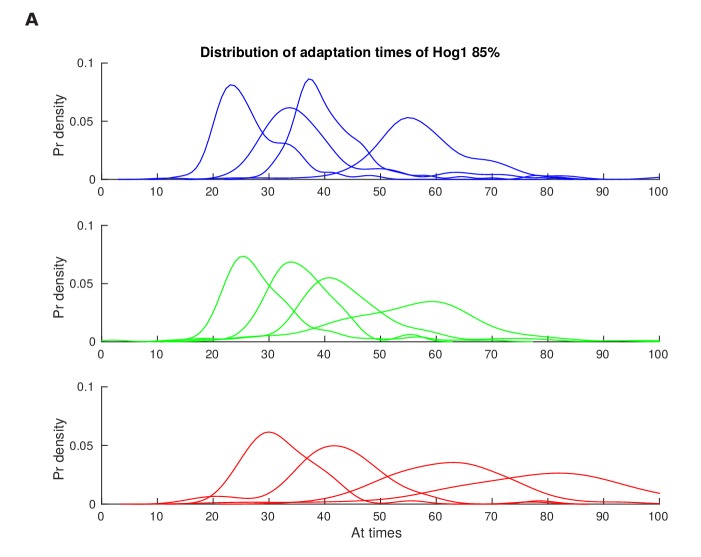
(A) Characterization of the wild-type (WT) and mutant strains in response to a 1 M sorbitol step. Colours here and in all following figures: blue (WT); green (fast mutant—ssk1); red (slow mutant—ste11). Mean responses are shown and error bars are SEM. See also Video 1. (B) Normalized response from wild-type cells to illustrate the degree of matching between the time of adaptation of Hog1 (the time for nuclear Hog1 to undergo a 85% decrease from its maximum) and the time of volume recovery (the time for the volume to undergo a 85% increase from its minimum). (C) Accuracy is the correlation between the adaptation times and is lowest for the fast mutant in late stages of the volume recovery (data from six experiments with at least 500 cells per strain; Figure 2—figure supplement 1). Error bars are 95% confidence intervals for the mean calculated by bootstrapping. (D) Adaptation of Hog1 in single cells becomes less sensitive to the magnitude of the stress in the fast mutant. The mutual information between the distributions of adaptation times of Hog1 and the magnitude of the steps from four experiments shows that the fast mutant becomes the least informative late in adaptation explaining the drop in correlation in C. Error bars are 95% credible intervals for the mean calculated by bootstrapping. Differences between strains are therefore at a 5% significance level when the error bars do not overlap.


