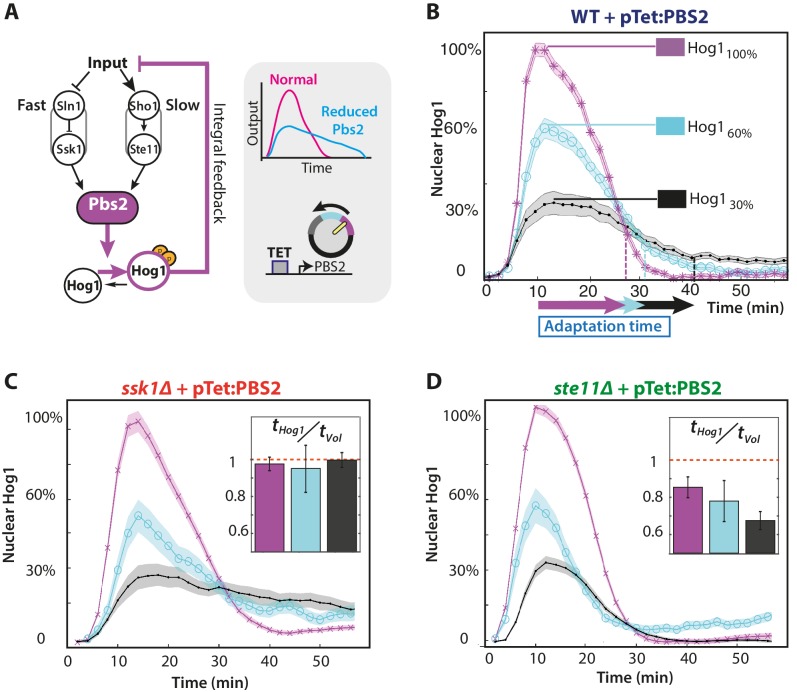
Figure 3. The slow pathway specializes in matching Hog1 dynamics to volume recovery by being most sensitive to the network’s integral feedback.
(A) Before reaching Hog1, the signals from each pathway are transduced through Pbs2, and we perturb the HOG network by controlling PBS2 expression through a TET inducible promoter. Reduced induction of PBS2 compromises the network and decreases the maximum activity of Hog1. This reduction in activity should be compensated by the system’s integral feedback lengthening the nuclear residence of Hog1 (box inset). (B) Measuring relative to unperturbed Pbs2, under-expression of Pbs2 reduces the amplitude of mean Hog1 nuclear localization, but increases its adaptation time on average in wild-type cells (1 M step; arrows indicate time for 85% adaptation). (C,D) Mean Hog1 dynamics for the slow and fast mutants show that only the slow mutant extends the adaptation time of Hog1 like the WT. Insets: Mean ratio for three experiments of the adaptation time of Hog1 to the adaptation time of the volume in single cells. Error bars are SEM.


