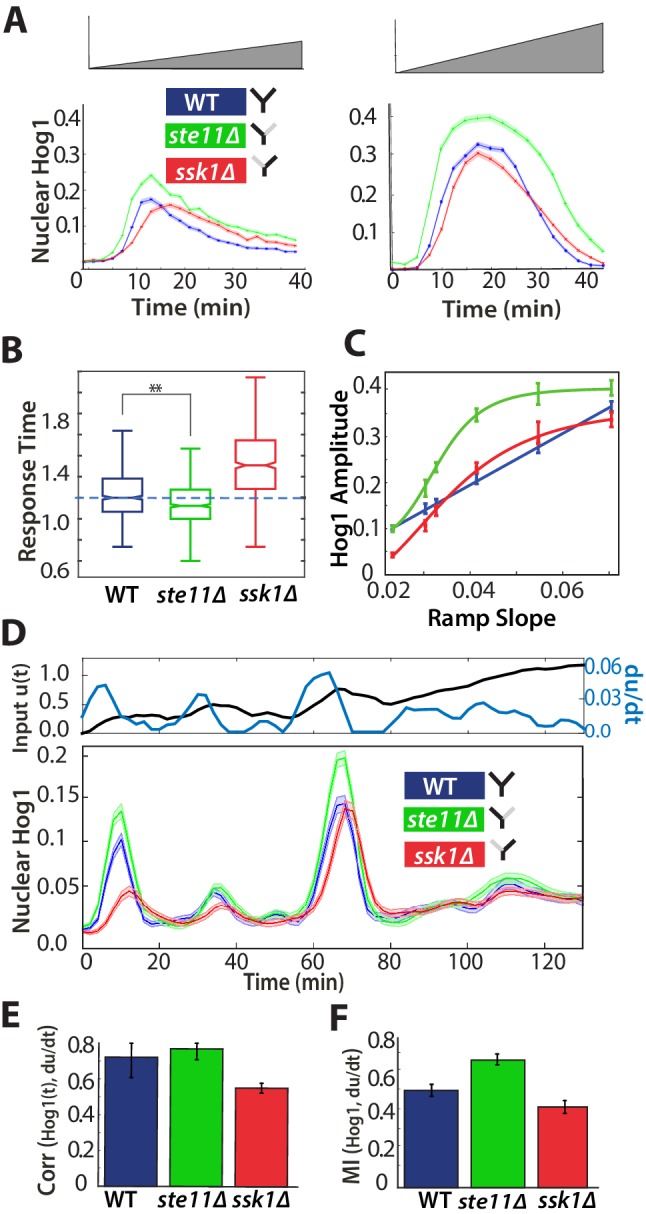
Figure 4. A component of the fast pathway that responds to the time-derivative of the input enables its high speed.
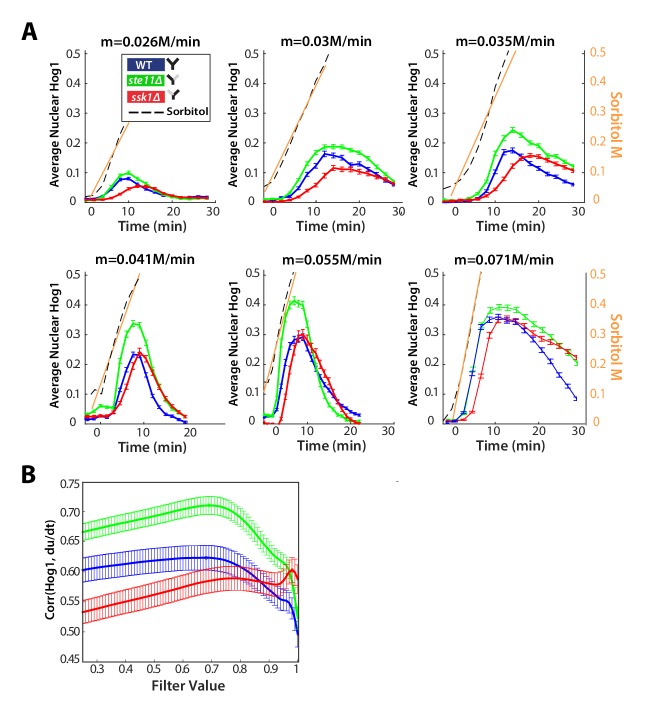
(A) The Hog1 trajectory in the fast mutant overshoots the Hog1 trajectories of both the wild-type and the slow mutant in ramp inputs (two examples with different slopes of approximately 0.03 M min and 0.06 M min). The mean response is shown and error bars are SEM. (B) Distributions of response times relative to the wild-type for six different ramps (Figure 4—figure supplement 1) shows that the fast mutant is even quicker than the wild-type on average (-value using a t-test for distributions with at least 600 cells per strain). (C) The average amplitude of the Hog1 response for the fast mutant consistently overshoots the wild-type for ramp inputs, which responds linearly to the slope of the ramp. (D) An input with a fluctuating time-derivative shows the average Hog1 response of the fast mutant consistently over-shooting the wild-type. Errors are SEM. (E) The average of the single-cell cross-correlations of the trajectories of Hog1 with the trajectory of the (smoothed) time-derivative of the input shows that the high correlation of the wild-type comes from the fast and not the slow pathway (average of three independent experiments with fluctuating ramps and error bars as SD; -value using a t-test on pooled single-cell data from the three experiments). (F) The mutual information between the time-derivative of the input in D and the level of Hog1 at each time point shows that the fast mutant best predicts the time-derivative (at 5% significance level calculated using credible intervals of the median).


