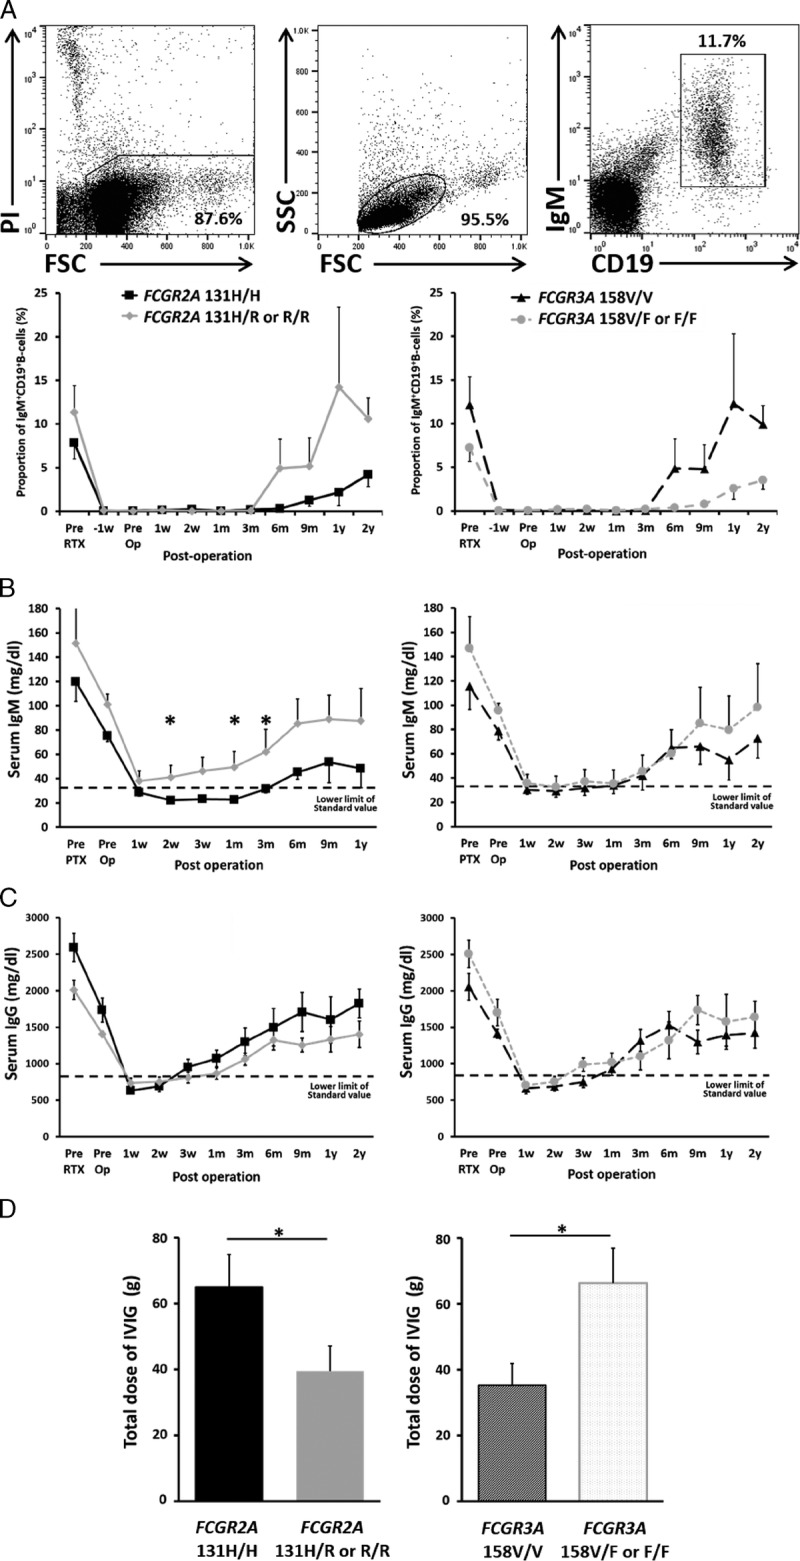
FIGURE 1.

Effects of rituximab on B cells were more profound in individuals with FCGR2A [131H/H] than in individuals with FCGR2A [131H/R or R/R]. A, A single dose of rituximab (375 mg/m2) was administered 2 weeks before transplantation. The proportion of IgM+CD19+ B cells in peripheral blood mono nuclear cells were determined by flow cytometry at different time points. Each point represents the mean and standard error of the mean at the individual time point as described. Representative gating strategy for the flow cytometry were shown. B, C, Total IgM (B) and IgG (C) levels in serum were analyzed at different time points as described. Dotted lines indicate lower limits of standard value. Each point represents the mean and standard error of the mean at the individual time point. D, Total dose of IVIg administered within 30 days after operation were shown. Data represent mean and standard error of the mean. The results were statistically analyzed using the Mann-Whitney U test. (FCGR2A [131H/H] : n = 10/[131R/R or R/H]: n = 10, FCGR3A [158V/V] : n = 9/[158F/F or F/V] : n = 11, *P < 0.05). RTX, rituximab.
