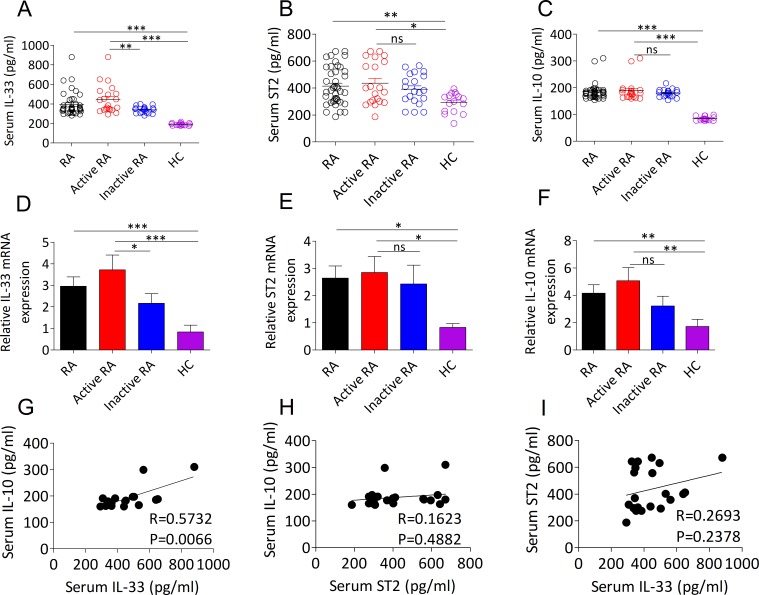
Figure 1. Expression levels of IL-33, ST2 and IL-10 in the serum and PBMCs from RA patients.
A., B., C. Serum IL-33 A., ST2 B. and IL-10 C. levels from RA patients (n = 41) and HCs (n = 16) were quantified by ELISA. Symbols represent individual samples. D., E., F. The mRNA expressions of IL-33 D., ST2 E. and IL-10 F. in PBMCs from RA patients (n = 41; active, n =21; inactive, n =20) and HCs (n = 16) were detected by RT-PCR. G., H., I. The correlation between serum IL-33, ST2 and IL-10 in active RA patients. Statistical significance was evaluated by the Spearman’s rank correlation test. Data are means ± SEM. *p < 0.05, **p < 0.01, ***p < 0.001. ns = not significant.

