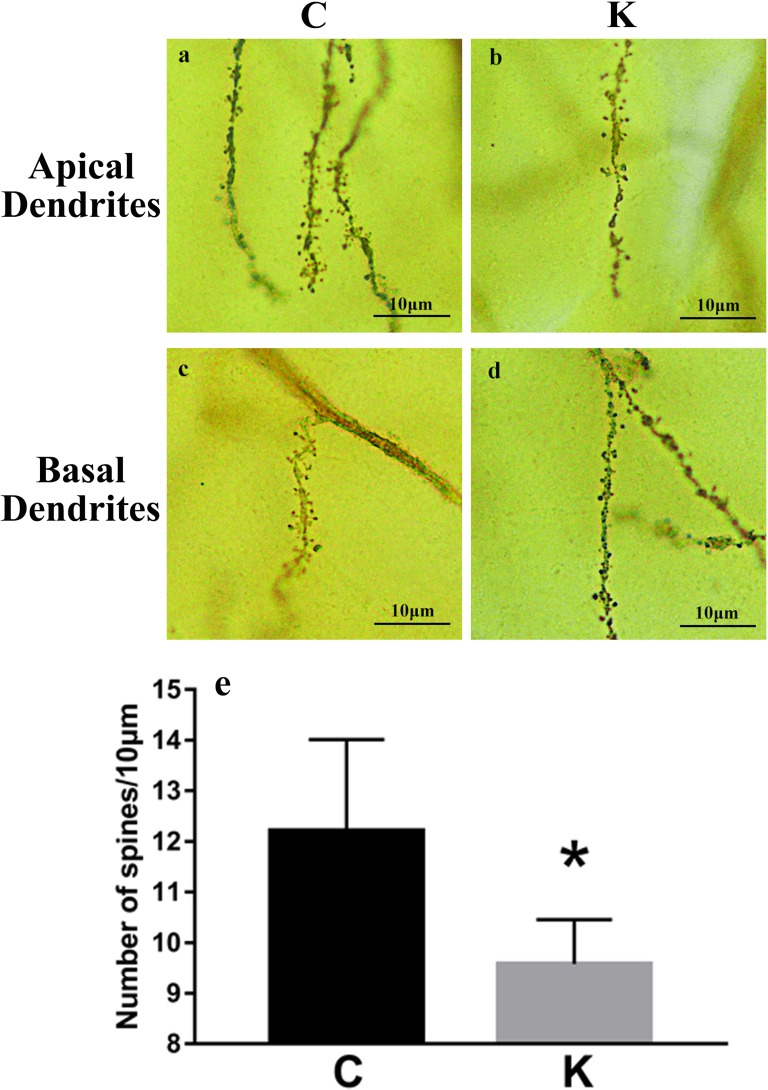
Figure 3. Golgi staining revealed hippocampal dendritic spine density.
10 μm of apical a. and b. and basal c. and d. dendrites were randomly selected from each pyramidal neuron for inspection (via 200 × oil immersion lens) to quantify spinal density. e. Spinal density decreased by 21.6% in K group compared to C group (p < 0.05).

