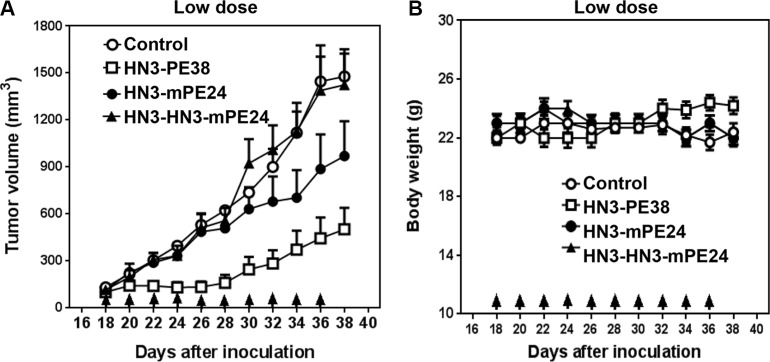
Figure 4. Comparison of anti-tumor activity of immunotoxins at a low dose in mice.
(A) Anti-tumor activity indicated by immunotoxins. Nude mice were s.c. inoculated with 8 × 10⁶ Hep3B cells. When tumors reached an average volume of 100 mm3, mice were administered indicated doses of immunotoxins intravenously (0.6 mg kg−1) every other day for ten injections. Arrows indicate individual injections. Control and HN3-HN3-mPE24: n = 8, HN3-PE38 and HN3-mPE24: n = 9. Values represent mean ± SE. (B) Body weight of the mice treated in A. Arrows indicate individual injections. Values represent mean ± SE.

