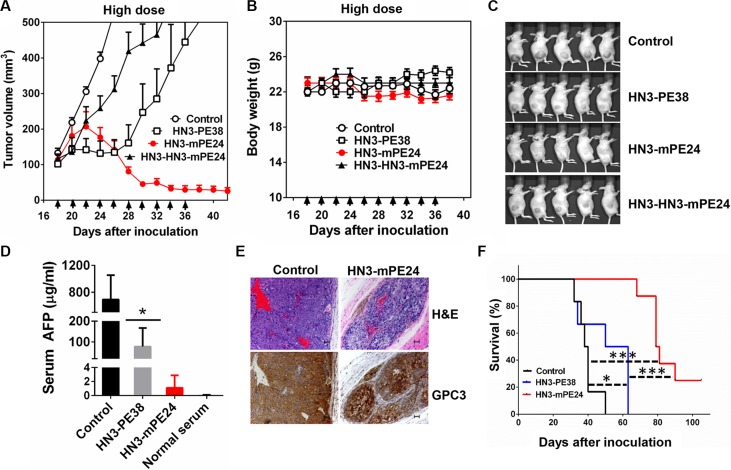
Figure 6. Anti-tumor activity comparison of anti-GPC3 immunotoxins at their tolerated doses in mice.
(A) Anti-tumor activity of HN3-PE38, HN3-HN3-mPE24 and HN3-mPE24 at their tolerated dose. Nude mice were s.c. inoculated with 8 × 10⁶ Hep3B cells. When tumors reached an average volume of 100 mm3, mice were administered HN3-PE38 (0.6 mg kg−1), HN3-HN3-mPE24 (2.5 mg kg−1) and HN3-mPE24 (5 mg kg−1) intravenously every other day for ten injections. Right panel shows amplified curves below 300 mm3. Arrows indicated individual injections. (B) Body weight of the mice treated in A. Arrow indicated individual injections. Values represent mean ± SE. (C) Representative photographs of treated mice at day 38. (D) Mouse serum AFP levels at day 38. Values represent mean ± SD. P* < 0.05. (E) H&E and immunohistochemistry staining of GPC3 on control and HN3-mPE24 treated tumor at day 38. Scale bar: 50 μm. (F) Survival curve for mice treated in A. *p < 0.05, ***p < 0.001 and ****p < 0.0001.

