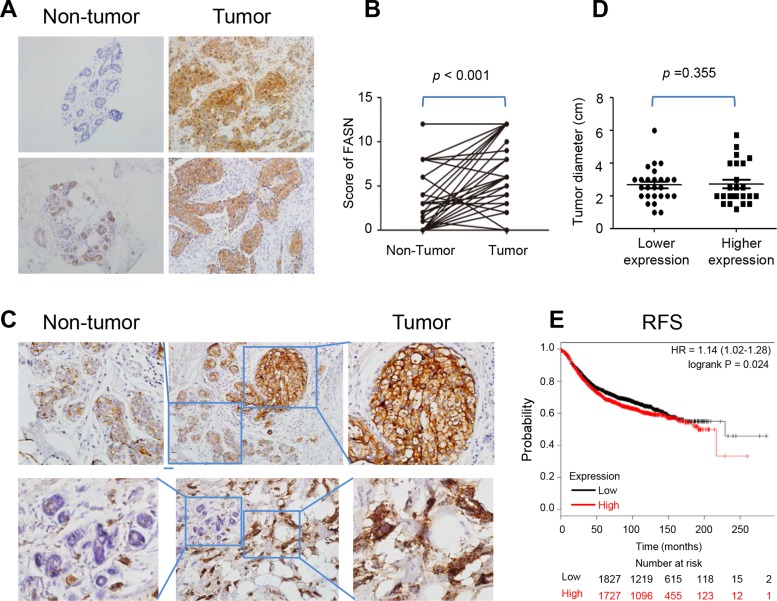
Figure 1. Expression of FAS in breast cancer tissues.
(A) The present IHC pictures of FAS in non-tumor breast and breast cancer tissues. (B) The scores of FAS in 50 paired non-tumor breast and breast cancer tissues. (C) The expression level of FAS in non-tumor breast was lower than breast cancer tissues in the same microscopic vision. (D) The relationship between tumor diameter and FAS expression level. FAS lower expression: score 0–4; FAS higher expression: score 5–12. (E) The higher FAS abundance correlated with a poor recurrence-free survival based on microarray data of 3554 breast patients in the website: www.kmplot.com.

