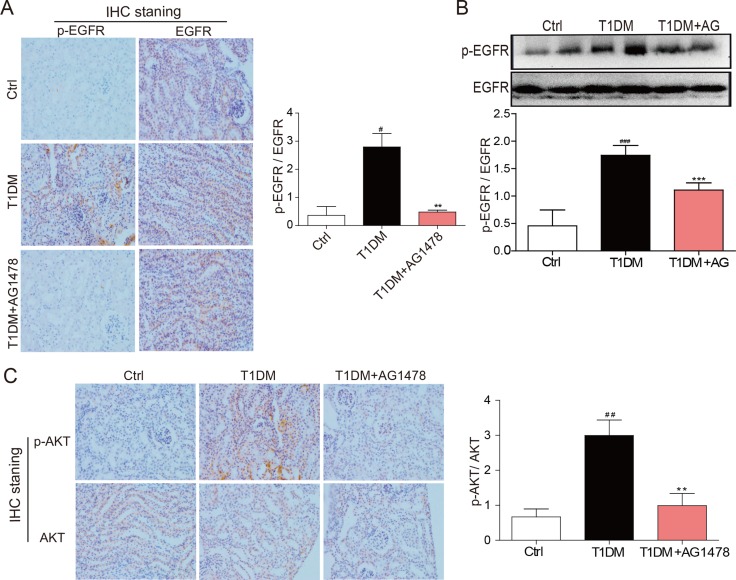
Figure 3. AG1478 attenuate diabetes-induced EGFR signaling activation in diabetic kidney.
(A) Representative images for the histochemical staining for p-EGFR and EGFR expression in the formalin-fixed renal tissues (200× magnification). (B) Western blot analysis for the expression of p-EGFR in renal tissue. And statistic figure was shown, data were presented as mean ± SDs. (C) Representative images for the histochemical staining for p-AKT and AKT expression in the formalin-fixed renal tissues (200× magnification). (Eight mice in each group were used for above analysis. **P < 0.01, ***P < 0.001 versus DN, #P < 0.05, ##P < 0.01, ###P < 0.001 versus vehicle control (Ctrl)).

