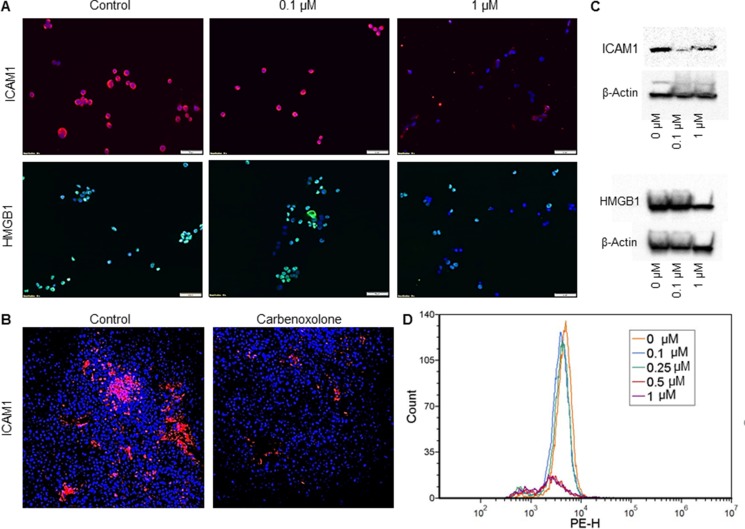
Figure 6. Effect of Carbenoxolone on HMGB1 and ICAM1 expression levels.
(A) Immunofluorescence staining of LLC cells after 1 hour incubation with Carbenoxolone. 50K cells/well were seeded in a 24 well culture dish and incubated overnight. Cells were stained for nuclei with DAPI (blue) and either ICAM1 (Cy3-red) or HMGB1 (Alexa flour 488 -green). (B) Tumor sections of Carbenoxolone treated mice stained for ICAM1 and DAPI. n = 8. (C) Western blot analysis of ICAM1 (top) and HMGB1 (bottom) expression in LLC cells post 1 hour incubation with Carbenoxolone. Blots are cropped, full blots can be found in Supplementary Figure 7 (D) Flow cytometry analysis of LLC cells incubated with for 1 hour. Fluorescent detection of ICAM1 was measured using Cy5. Duplicates of all samples provided the same effect.

