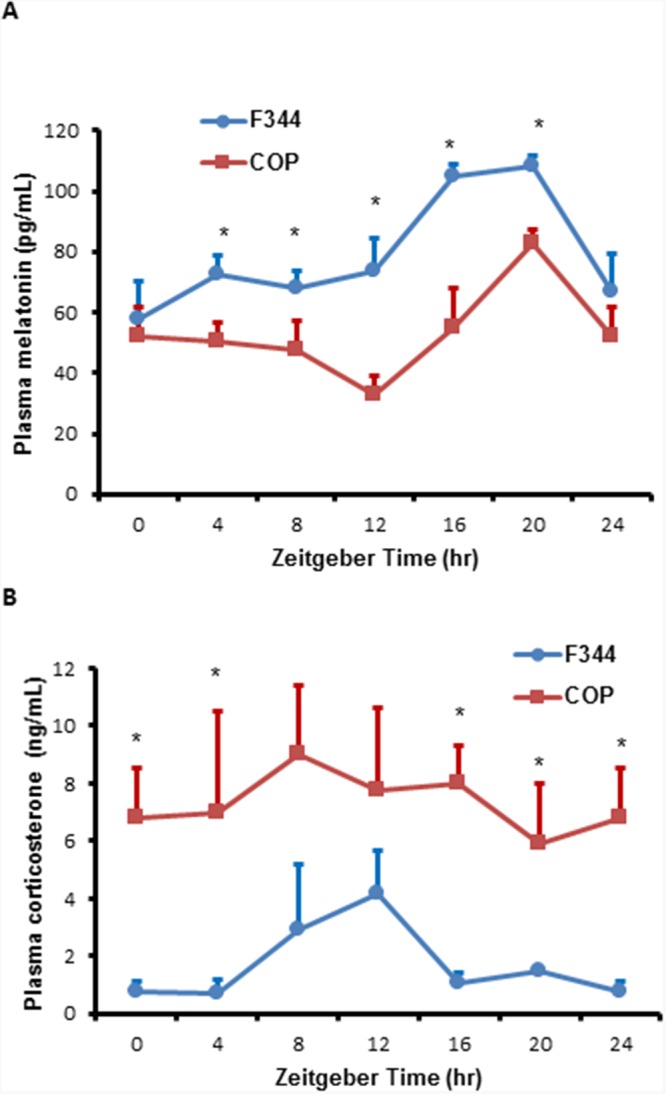
Figure 6. Comparison of plasma melatonin and corticosterone levels.

Three pubescent female COP (square) or F344 (circle) rats were sacrificed every 4 hours over a 24 hour period, beginning at 6 AM. (A) Plasma melatonin levels were determined using ELISA kit and plotted against Zeitgeber time (ZT). (B) Plasma corticosterone levels were determined using ELISA kit and plotted against Zeitgeber time (ZT). Values of mean ±SE (n=3 for each) are presented. * indicates statistical significance at p<0.05 between COP and F344 rat strains at the same time points.
