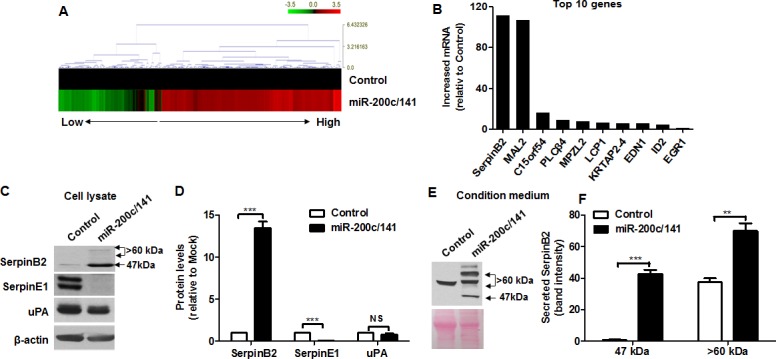
Figure 1. miR-200c/141 cluster overexpression upregulates SerpinB2.

Heat map of relative gene expression in control and MDA-MB-231miR-200c/141 cells (A) Real-time RT-PCR analysis of the top 10 genes (SerpinB2, MAL2, C15orf54, PLCβ4, MPZL2, LCP1, KRTAP2-4, EDN1, ID2, and EGR1) (B) Representative images (C) and complete data (D) from SerpinB2, SerpinE1, and uPA western blots with control and MDA-MB-231miR-200c/141 cell lysates Representative SerpinB2 western blot with control and MDA-MB-231miR-200c/141 cell CM (E) Data from western blots of both SerpinB2 forms secreted from control and MDA-MB-231miR-200c/141 cells (F) ***P<0.001. NS, not significant.
