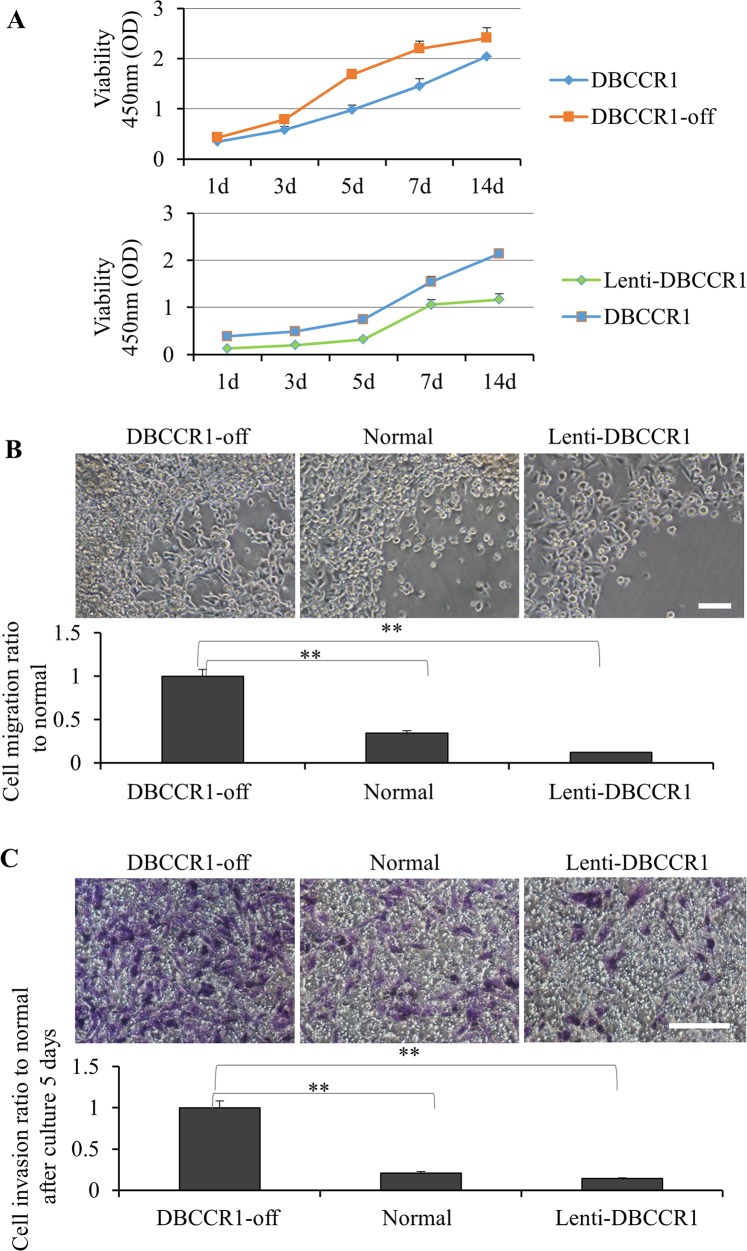
Figure 4. Change the expression of DBCCR1 effected the proliferation, migration and invasion in A549 cell line.
(A) CCK-8 assay was used to detect cell viability of A549 cells treated with DBCCR1-shRNA (compared with control shRNA) and Lenti-virus with DBCCR1. A549 cells were placed on 96-well plates (5×10³ cells/well) and incubated with fresh medium. Growth curves were detected. Points and range lines at different day (1, 3, 5, 7 and 14 days) represent mean and SD of at least three independent experiments in triplicate. OD value was measured at 450 nm and data demonstrated a significant growth induction by knockdown of DBCCR1 (p<0.01). (B) Migration kit assay with DBCCR1-shRNA (compared with control shRNA) and Lenti-virus with DBCCR1 was tested. Migration of the cells to the blank area was visualized at 72 h with an inverted Leica phase-contrast microscope (9200 magnification). Quantitation was shown on below (**P<0.01, compared with normal cell line). Data demonstrated a significant migration capacity induction by knockdown of DBCCR1. (C) The relation of DBCCR1 expression and invasion capacity was tested at 72 h after culturing cells by transwell assays. DBCCR1-shRNA cells showed lower penetration rate through the membrane compared with control-shRNA and mock cells. Scale bar 0.5 μm. Quantitation was shown on below (**P<0.01, compared with normal cell line).

