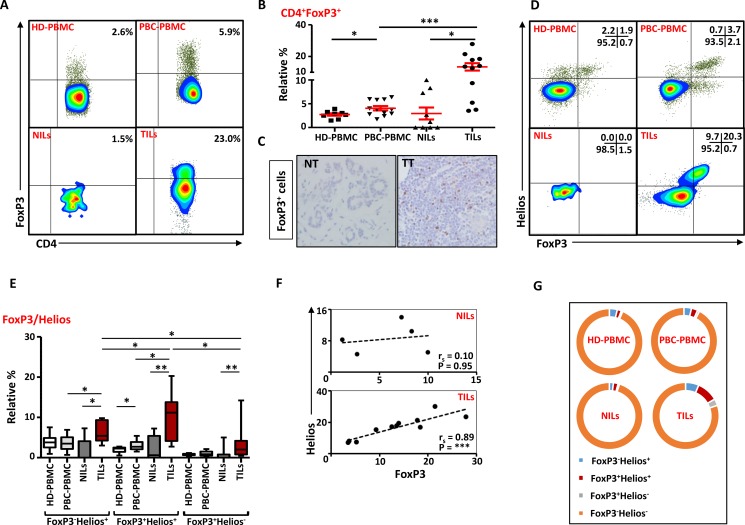
Figure 6. FoxP3 and Helios expression in CD4+ T cells.
PBMC from HD and PBC patients, NILs and TILs were stained for CD3 and CD4 antibodies followed by intracellular staining for FoxP3 and Helios. Live cells were first gated using Fixable Viability Dye 660. (A). Representative flow cytometric plots of FoxP3 staining from one cancer patient are shown. (B). Scatter plot showing the differences in frequencies of FoxP3+ Tregs between different samples. (C). IHC staining of FoxP3+ expression in one NT and TT samples. (D). Flow cytometric plots of FoxP3 and Helios co-expression in CD4+ T cells from different samples and whisker plots (E) showing differences in various FoxP3 and Helios-expressing Treg subsets. (F). Non-parametric Spearman's test showing correlations between FoxP3 and Helios expressions in NILs and TILs. (G). Pie charts show the relative percentages of different FoxP3 and Helios Treg subsets.

