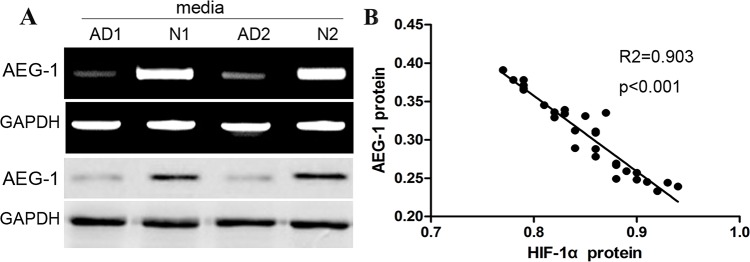
Figure 3. AEG-1 expression is negatively associated with the expression of HIF-1α in aortic media of AD tissues.
(A) Representative images of AEG-1 bands in aortic media of TAD and normal tissues. Expression level of AEG-1 protein was significantly higher in TAD than in normal. (B) Dot plots represent log10 AEG-1 expression against log10 HIF-1α protein expression level. The lines represent approximated curves. The correlation coefficient (r) and the P value indicate the statistical significance of the negative correlation between the x and y variables.

