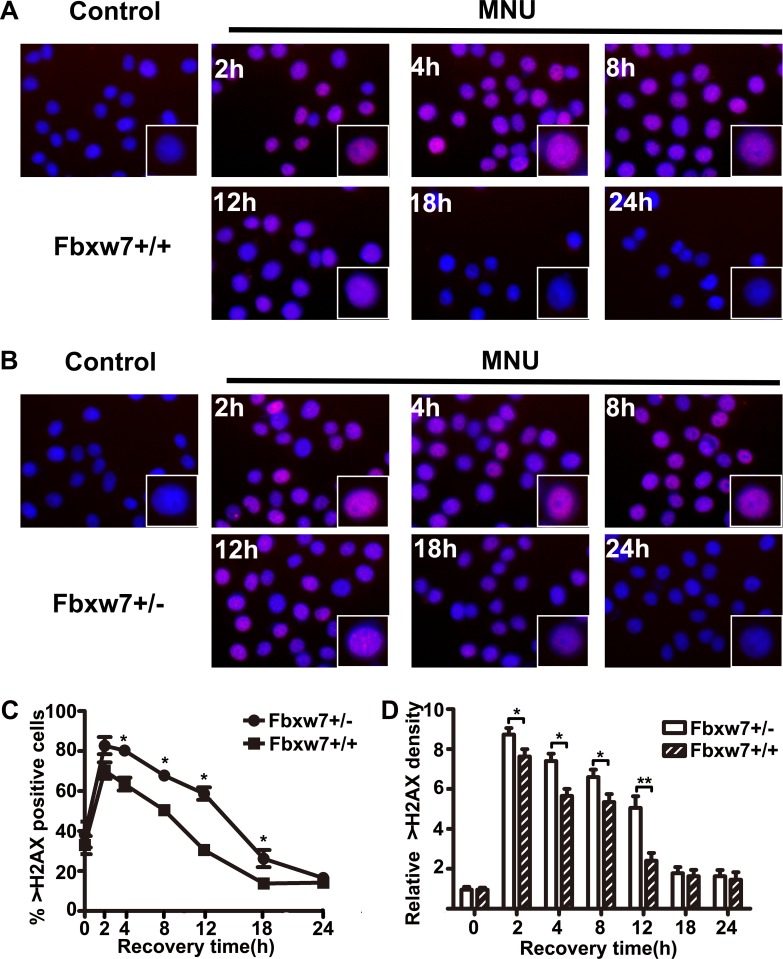
Figure 4. Bimodal pattern of H2AX phosphorylation after treatment with MNU.
(A, B) pH2AX foci in MEFs from Fbxw7+/+ (A) and Fbxw7+/− (B) after MNU treatment. The cells were collected and fixed at the indicated time points after treatment. (C, D) The dynamics of pH2AX foci formation after treatment as shown in (A) and (B). Data are presented as mean ± SD, from three independent experiments. The X2 or T test was used to determine the significance of pH2AX positive incidence and intensity. “*” refers to statistically significant (P < 0.05).

