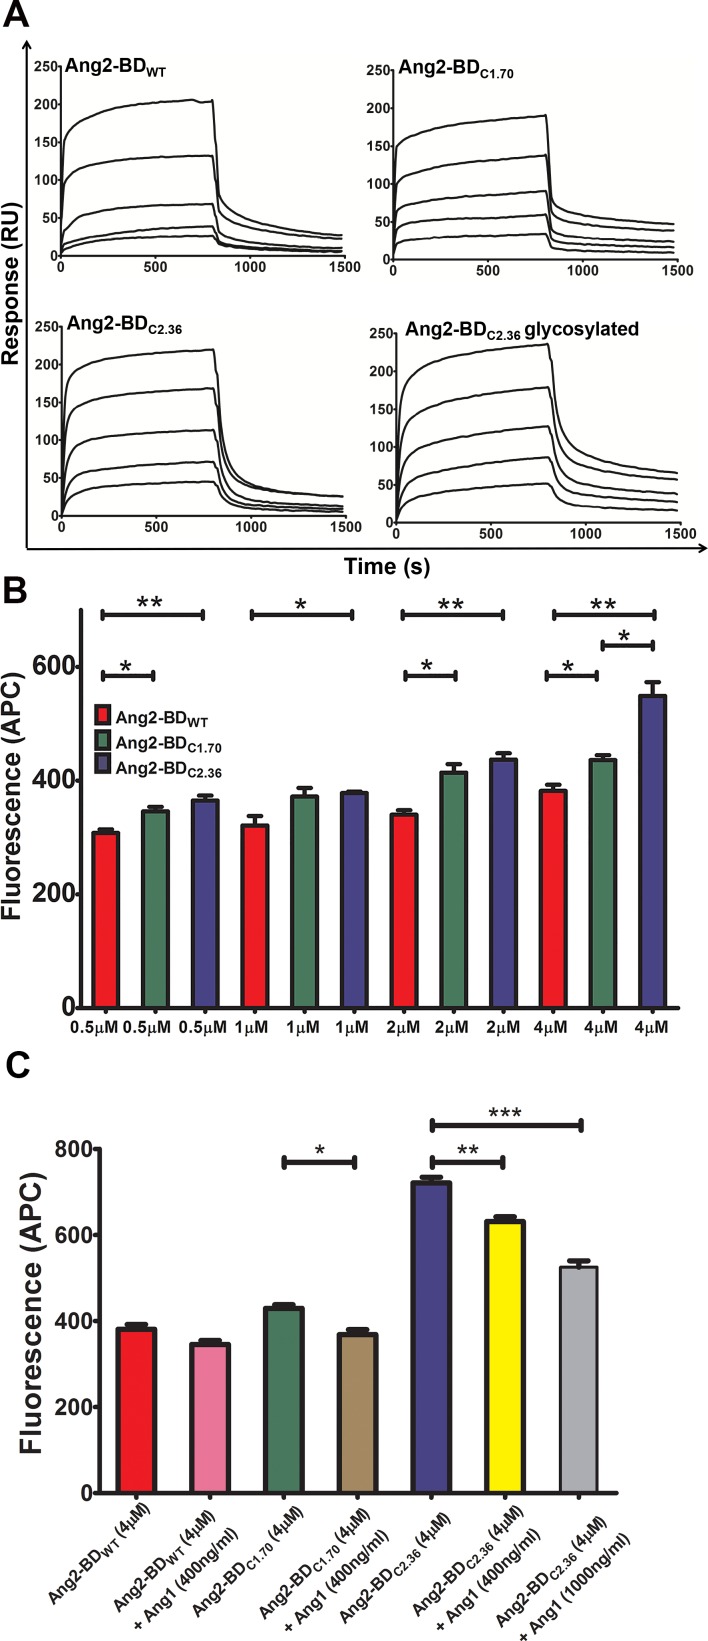
Figure 3. Binding of Ang2-BD variants to recombinant and cell-expressed human Tie2.
(A) Representative SPR sensorgrams of binding of Ang2-BD variants to immobilized Tie2. The ranges of protein concentrations analyzed are indicated in parentheses: Ang2-BDWT (18.75 nM – 300 nM); Ang2BDC1.70 (6.25 nM – 100 nM); Ang2-BDC2.36 (5 nM – 80 nM); Ang2-BDC2.36 glycosylated (6.25 nM – 100 nM). (B) Binding of Ang2-BD variants to TIME cell line: 1 ×10⁵ cells were incubated with indicated proteins (Ang2-BDWT, Ang2-BDC1.70 and Ang2-BDC2.36, red, green and blue, respectively) for 2 h at 4°C with a gentle agitation. Mean fluorescence values were determined by flow cytometry using a fluorescently labeled antibody against a FLAG epitope tag. Data shown is the average of triplicate experiments, and error bars represent standard error of the mean. *indicates P value < 0.05 for comparison of results between Ang2-BD variants at the same concentration. (C) Competitive binding assay of Ang2-BDWT, Ang2-BDC1.70 and Ang2-BDC2.36, without Ang1 (red, green and blue, respectively) and with 400 ng/ml Ang1 (pink, brown and yellow, respectively) and 1000 ng/ml Ang1 for Ang2-BDC2.36 competition (grey). *indicates P value <0.05 for comparison of results between Ang2-BD variants with and without Ang1. Data shown is the average of triplicate experiments, and error bars represent standard error of the mean.

