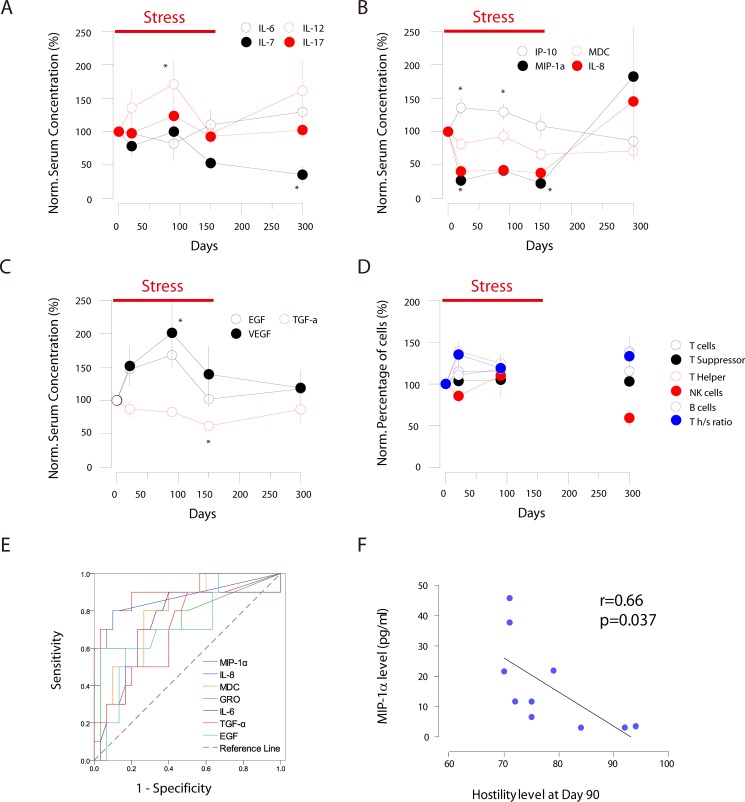
Figure 2. 2ABC: changes of different cytokines families during the stress period (Normalized to day 0).
(A) interleukin family cytokines; (B) chemokine family cytokines; (C) growth factor family cytokines; (D) changes of different groups of lymph cells (Normalized to day 0); (E) The ROC curve analysis of cytokine as the biomarker to stress-related disorders; (F) MIP-1α serum concentrations in correlated to hostility level across different individuals at day 90, suggesting for the varied vulnerability to stress. * Indicates that the P < 0.05 in compared to baseline level.

