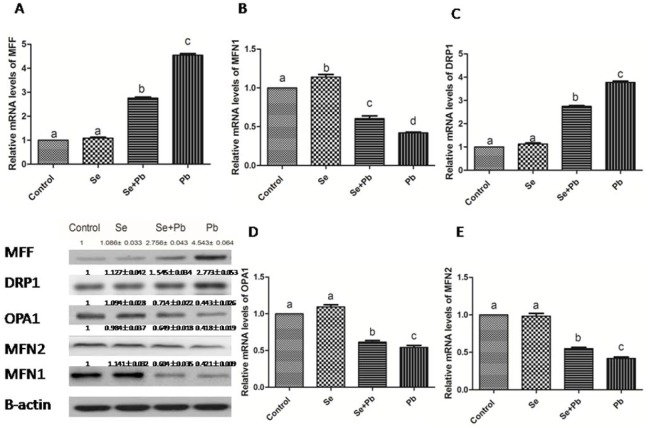
Figure 5. Effects of Se, Pb and Se+Pb treatment on the expressions of MFF (A), MFN1 (B), DRP1 (C), OPA1 (D) and MFN2 (E) in the spleen of chickens.
Each value represents the mean±SD (n=6/group). The bars sharing different small letters represent statistically significantly differences between the groups P < 0.05); the bars with a common letter are not significantly different (P > 0.05).

