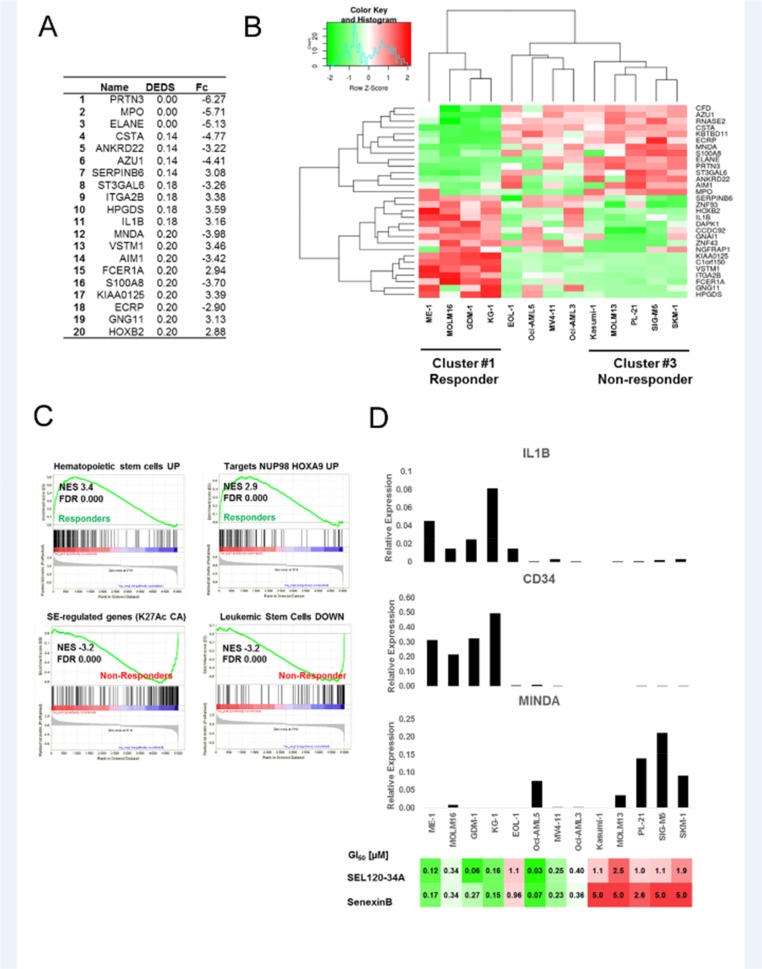
Figure 8. Identifying discriminating genes that can be used for predicting response to CDK8 inhibitors.
(A) Alist of the top 20 genes discriminating between CDK8 inhibitors responder and non-responder AML cells, ranked by DEDS scores, fold changes are shown (Fc). (B) Heat map showing results of clustering (Z-scores) for top discriminating genes between responder and non-responder AML cells. (C) GSEA for two classes: responder and non-responder cells. Running plots for sets (MSigDB C2 collection) with the most significant enrichment scores (NES) in both responder and non-responder classes are shown. (D) CD34, IL1B and MNDA mRNA expression levels were analyzed in AML cell lines from the panel B by qRT-PCR. Relative expression levels normalized to GAPDH are shown (representative biological repeat n=2, mean values from technical repeats n=3). Heat map presenting GI50 values for tested AML cells lines treated with SEL120-34A and Senexin B in extended viability assays is presented below for a comparison with gene expression data.

