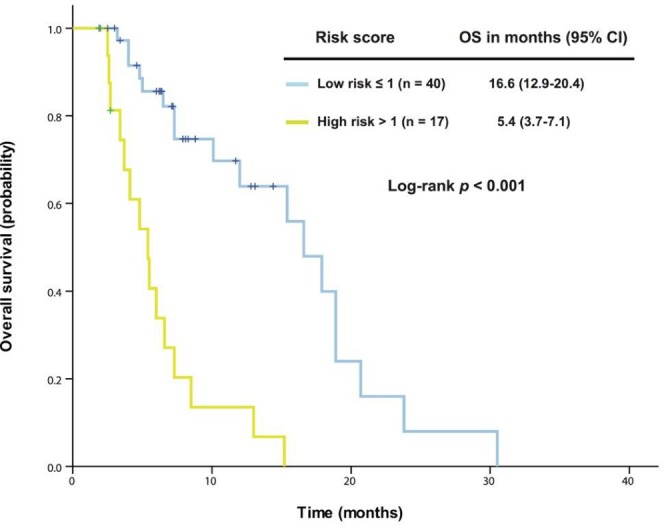
Figure 3. A prognostic model was established from 57 patients with advanced KRAS+/TP53+ mutant cancer who received therapy in a phase I clinical trial.

Kaplan-Meier overall survival (OS) curves are shown, stratified by risk score (low-risk group: score ≤1, high-risk group: score >1) (due to sample size, all p values are unadjusted).
