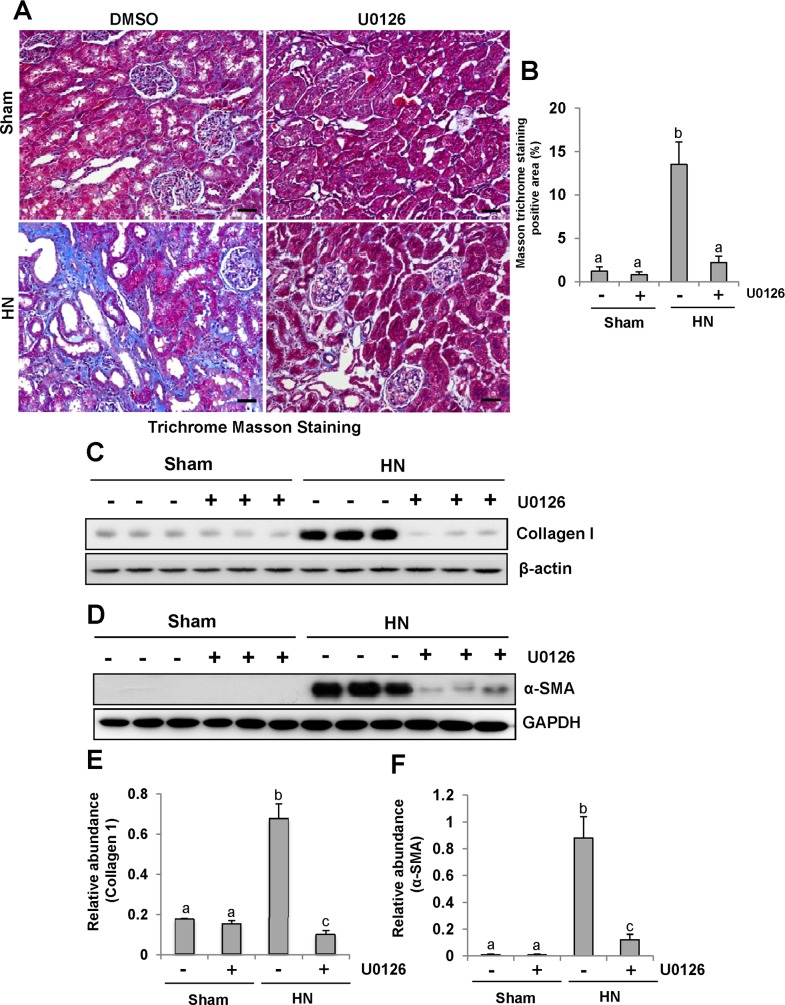
Figure 5. U0126 alleviates the development and progression of renal fibrogenesis in hyperuricemic rats.
(A) Photomicrographs illustrating Masson trichrome staining of kidney tissue collected at day 28 after feeding of mixture of adenine and potassium oxonate with or without U0126. (B) The graph shows the percentage of Masson-positive tubulointerstitial area (original magnification, ×200). The kidney tissue lysates were subjected to immunoblot analysis with specific antibodies against collagen I or-β-actin(C), as well as α-SMA or GAPDH (D). (E) Expression level of collagen I was quantified by densitometry and normalized with β-actin. (F) Expression level of α-SMA was quantified by densitometry and normalized with GAPDH. Data are represented as the mean±SEM (n=6). Means with different letters are significantly different from one another (P<0.05). The scale bar in all of the images is 20 μm.

