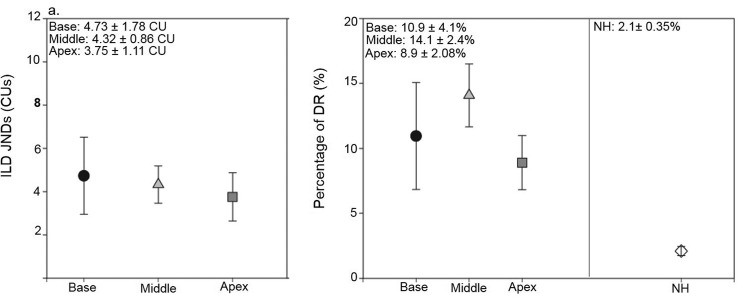
FIG. 3.
Average (±1 standard error) ILD JNDs (a) and ILD JNDs expressed as a percentage of DR (b) are shown for the three locations across the array. JND values represent the ILD difference from 0 CU at which thresholds were reached. For example, a JND of 2 CU would mean that there was a total difference of 4 CU between the two ears. In addition, comparisons are made with data that were previously published in NH children (Ehlers et al., 2016).

