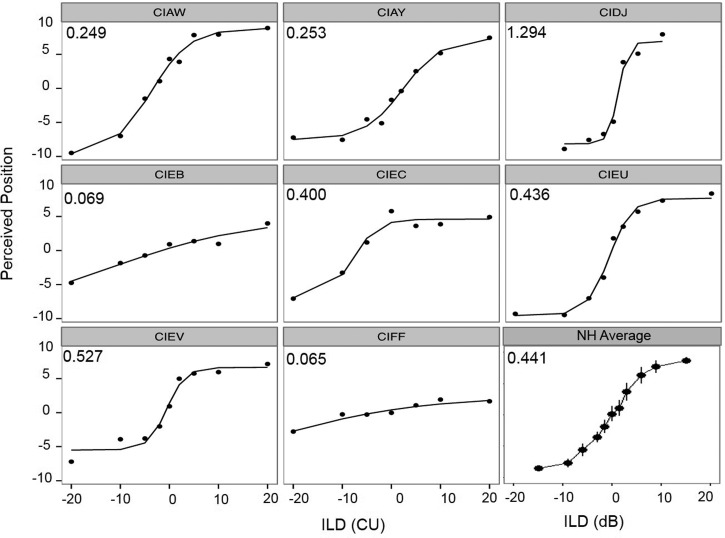
FIG. 5.
Individual data from the lateralization task are shown for ILD data. In each panel, data from a single subject indicate the average perceived intracranial position as a function of ILD. Slope values are inserted in the top left corner of each panel. In the bottom right panel, the overall average intracranial positions for NH children as a function of ILD are replotted from Ehlers et al. (2016). The average ILD slope value for the NH children is inserted in the top left corner of the panel.

