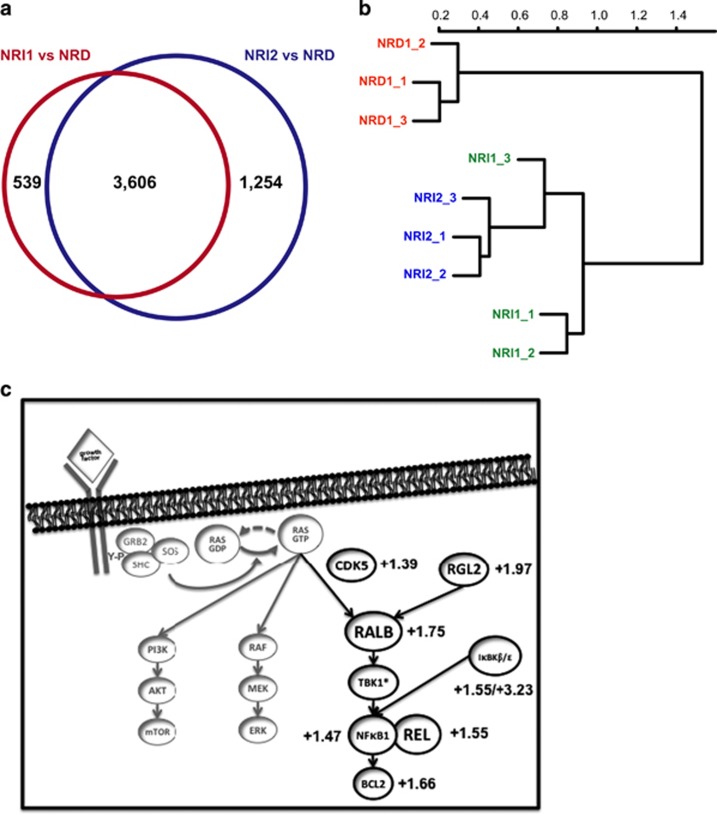
Figure 4.
Next-generation sequencing analysis of de novo NRD AML and relapsed NRI AMLs. (a) Differential transcript levels between splenocytes from leukemic mice with de novo NRD AML after 72 h of Dox treatment and relapsed NRI1 and NRI2 AMLs (n=3 mice per group, differential expression defined as Benjamini–Hochberg-corrected q-value of ⩽0.01- and 1.5-fold change). All mice with NRI AMLs were maintained on Dox to suppress NRAS(V12) expression. (b) Hierarchical clustering of de novo NRD and relapsed NRI1 and NRI2 AMLs. (c) Expression of RALB-associated transcripts that are enriched in both relapsed NRI AMLs compared to de novo NRD AML. Fold change (NRI/NRD) is indicated and the Benjamini–Hochberg corrected q-value is ⩽0.01 for all transcripts.

