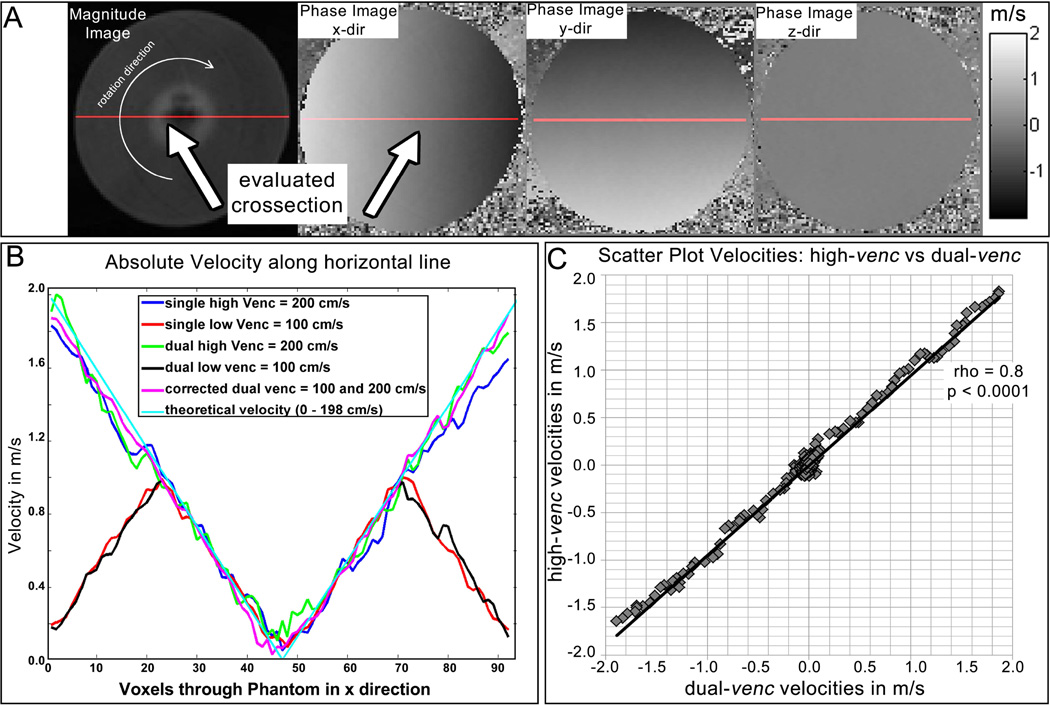
Figure 5.
A. Magnitude and corresponding phase difference images of the rotation phantom in an axial cut plane. The cross section through the center of the phantom used for velocity quantification is shown by the red line. The arrow in the magnitude image indicates the direction of rotation. B. measured absolute along the cross section. The blue and green curves represent the high-venc scans measured with a venc of 200 cm/s, and the red and black lines represent the low-venc scans with aliasing at the outer voxels (venc = 100 cm/s). The magenta line represents the combined data set (dual-venc corrected scan) showing the result after dual-venc reconstruction. The cyan line corresponds to the calculated velocity assuming 198 cm/s at the outer diameter at 4.5 rev/s. C. Correlation of absolute velocities along the horizontal line for dual- vs high-venc shows a significant Spearman rank sum correlation of ρ = 0.8, indicating successful velocity anti-aliasing by dual-venc reconstruction.

