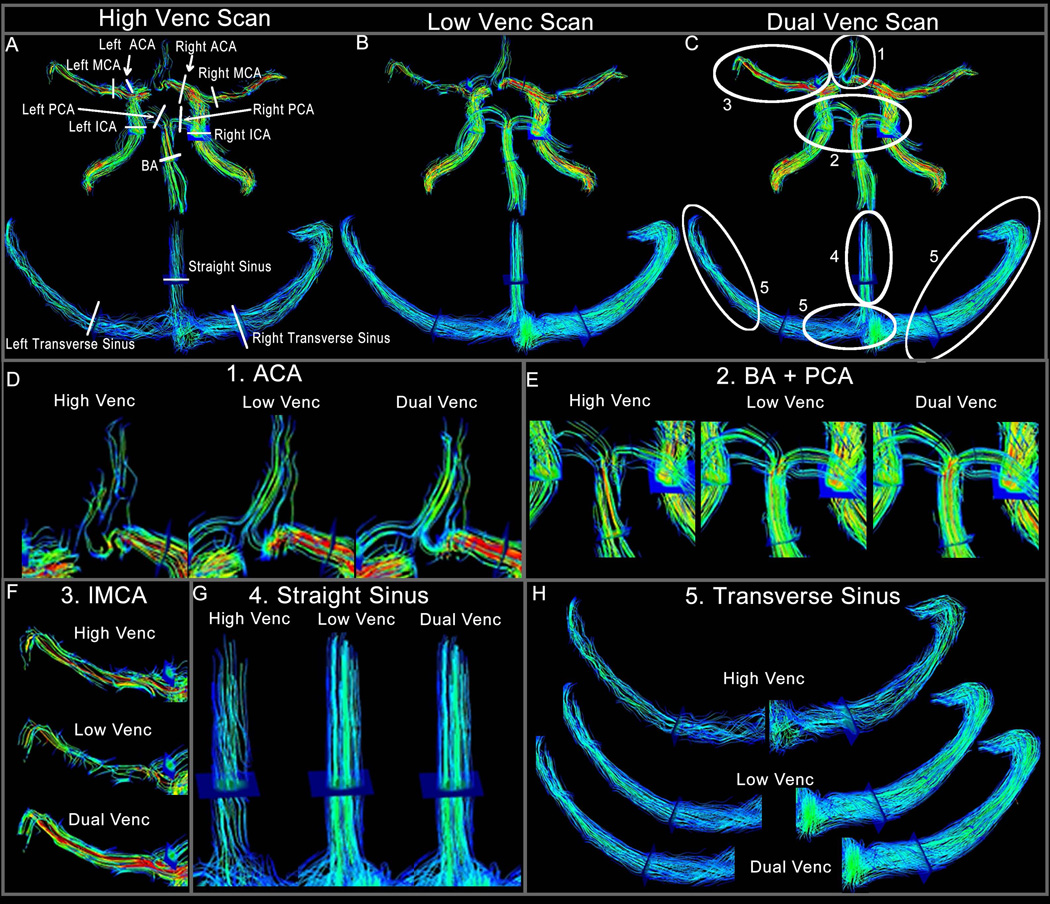
Figure 6.

Panels A–C show an example of one volunteer with 3D streamlines emitted from the entire angiogram volume for all three 4D flow scans (A high-venc, B low-venc and C dual-venc). The plane locations for flow quantification and quality assessment are illustrated in A. Those planes were also used to determine net flow and peak velocity. In panels D–H the areas in which dual-venc 4D-flow MRI provided superior flow visualization are zoomed. Panel D shows more as well as more coherent streamlines for the ACA. Panel E shows the BA and PCA, panel F shows disrupted streamlines in the low-venc, which are corrected in the dual-venc and panels G and E show examples of the slow flow venous system.
