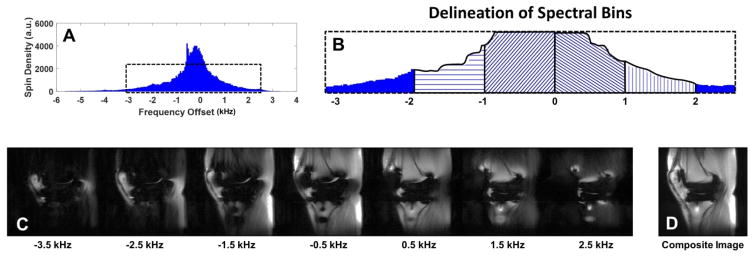
Figure 5.
Schematic diagram of the multi-acquisition variable resonance image combination (MAVRIC) technique. The proton spectrum (A) is partitioned into separate frequency bins (B, 4 bins delineated) from which individual image datasets are created (C) at the specified frequency offsets. The data sets are then combined to generate a composite image (D).

