Fig. 2.
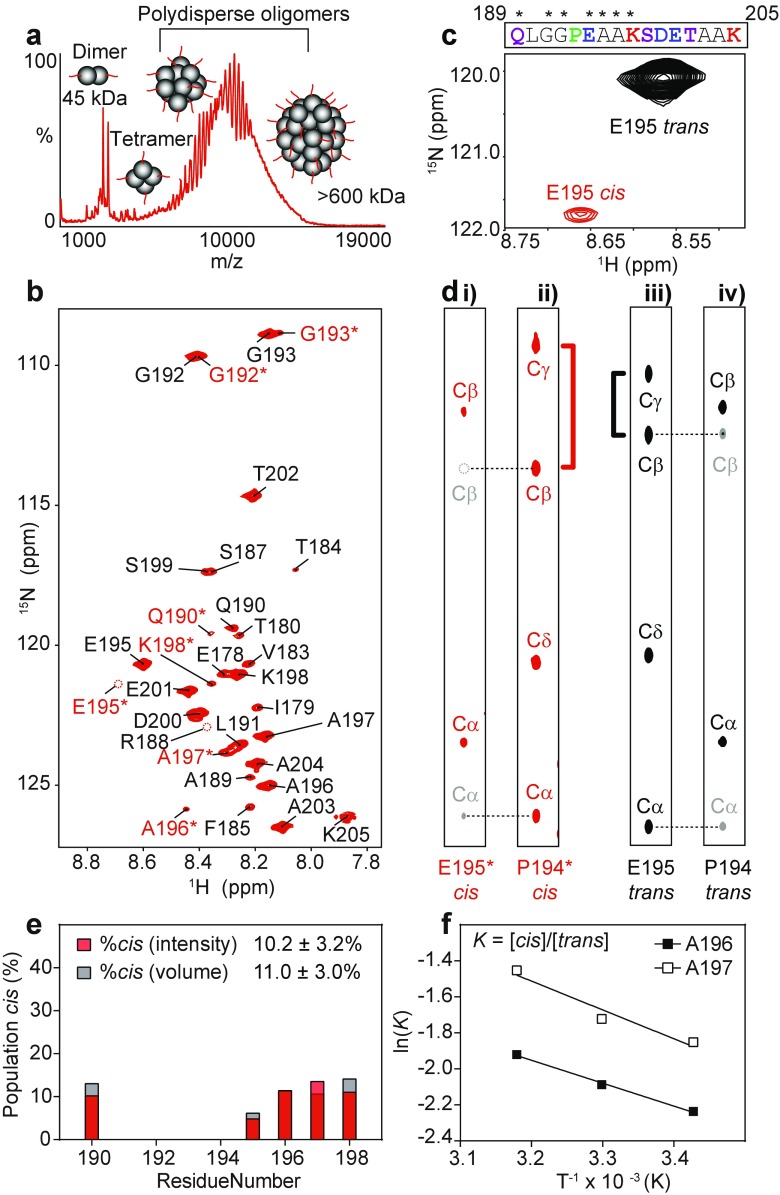
Cis-trans proline isomerization about the G193-P194 peptide bond in HSP27. a Native mass spectrum of 25 μM HSP27 in 200 mM ammonium acetate, pH 6.9. The y-axis depicts signal intensity and the x-axis displays the mass-to-charge ratio. b 2D 1H-15N HSQC spectrum of 2 mM [U-13C,15N]-HSP27 at 298 K in 30 mM NaH2PO4, 100 mM NaCl, 2 mM EDTA, 2 mM NaN3, pH 7. Each peak corresponds to an N–H bond and resonance assignments are listed next to each peak. Residues that are colored in red and labeled with an asterisk (*) indicate doubled peaks. The dashed circles indicate resonances that are weak and not observable at the plotted contour level. See Fig. S1 for a lower contour HSQC spectrum. c Residues that exhibit two peaks are shown with asterisks (*) above their one-letter amino acid code. A zoomed-in region from b, which shows the major (black) and minor (red) peaks that arise from E195. d 2D 1H-13C strip plots taken from 3D HNCACB (i. and iv.) and C(CO)NH (ii. and iii.) spectra at the 15N frequency corresponding to E195 or E195*. In the HNCACB spectrum, the 13Cα and 13Cβ nuclei from E195 (red/black) and P194 (gray) are indicated with dashed lines to reveal their corresponding positions in the C(CO)NH spectrum taken at the E195 15N frequency. The difference between 13Cβ and 13Cγ chemical shifts in proline residues is diagnostic of cis- or trans-proline bonds. In the minor state, the 13Cβ and 13Cγ chemical shift difference is ~10 ppm (red), indicative of a cis-conformation, whereas in the major state this difference is only ~5 ppm (black), indicative of a trans-conformation. e The population of cis-P194 at 298 K is shown for each residue with well-resolved cis and trans peaks in the 1H-15N HSQC spectrum. Both the peak intensity (red) and integrated volume (gray) are shown, and the average value ±1 standard deviation is listed. f The natural logarithm of the equilibrium constant for cis-trans isomerization about the G193-P194 peptide bond is shown as a function of temperature. This analysis yields a change in enthalpy (ΔH) and change in entropy (ΔS) of 13.5 kJ mol−1 and 3.5 J mol−1 K−1, respectively, upon formation of the cis-G193-P194 peptide bond

