Figure 3.

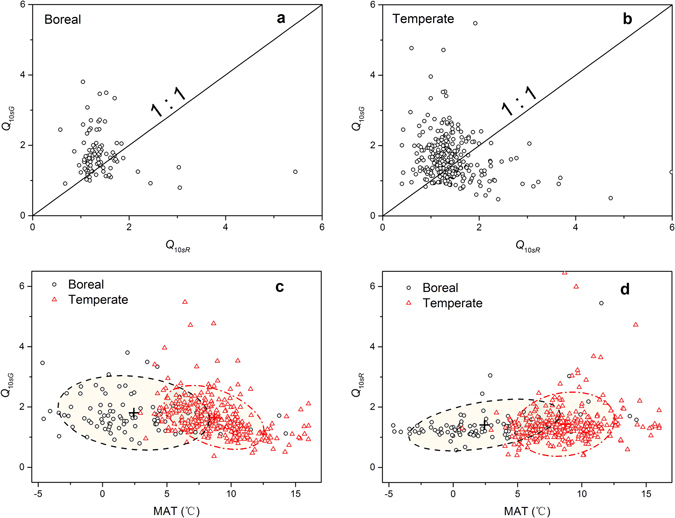
The intrinsic temperature sensitivity of gross primary production rate (Q 10sG) vs. that of respiration rate (Q 10sR) in (a) the boreal region and (b) the temperate region, and changes of (c) Q 10sG and (d) Q 10sR with the mean annual temperature (MAT) in the two regions. The confidence ellipses in (c,d) were derived at the level of one standard deviation of probability distribution and the symbol “+” indicates the center of ellipse.
