
Figure 3.
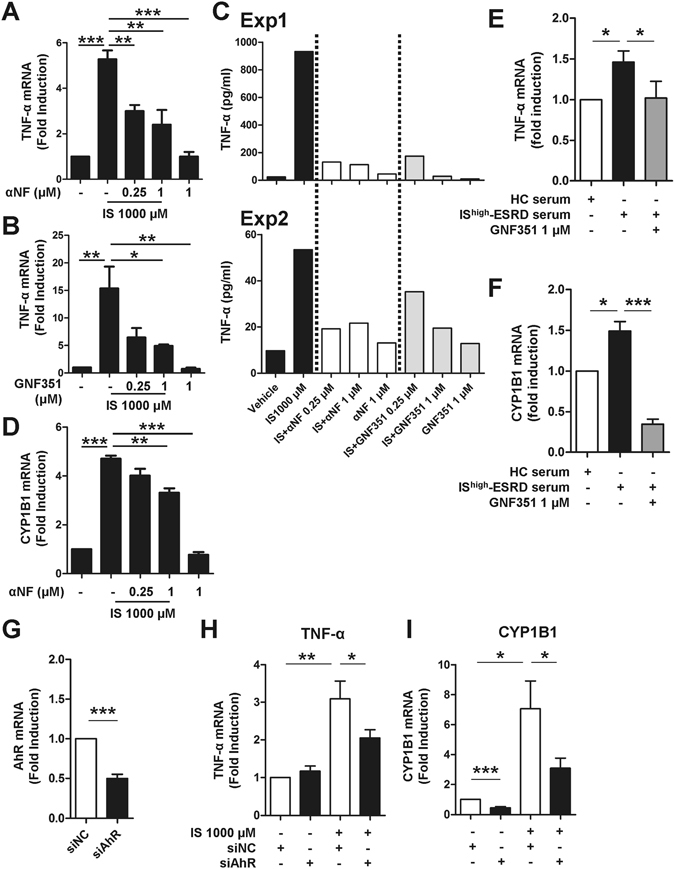
IS-induced TNF-α expression is regulated through AhR activation in human monocytes. Monocytes were co-treated with IS and AhR antagonists, α-NF or GNF351, at the indicated concentration for 24 or 48 hr. (A and B) At 24 hr post-treatment, TNF-α mRNA expression was analyzed by real-time RT-PCR. (C) At 48 hr post-treatment, the amount of TNF-α in the culture supernatant was quantified by ELISA. Two representative experiments of five are shown. (D) At 24 hr post-treatment, CYP1B1 mRNA expression was analyzed by real-time RT-PCR. Expression of β-actin was used as a normalization control. (E and F) Sera were pooled from patients with the top 10 (IShigher-ESRD) IS serum concentrations. As a control, sera from healthy controls were pooled. Monocytes isolated from healthy controls were treated with 30% (v/v) of the indicated sera for 24 hr with or without 1 μM of GNF351. Gene expression levels were analyzed by real-time RT-PCR. (G) Knockdown efficiency of AhR. Freshly purified total monocytes were transfected with AhR-specific or control siRNA (20 pmol of both siRNAs). AhR mRNA expression was analyzed at 24 hr after transfection by real-time RT-PCR. (H and I) siRNA transfected monocytes were treated with IS for 24 hr. Real-time RT-PCR was performed for analysis of TNF-α and CYP1B1 mRNA expression. Expression of β-actin was used as a normalization control. Bar graphs show the mean ± SEM of five (A) or four (B and D) or six (E–I) independent experiments. *p < 0.05, **p < 0.01, and ***p < 0.001 by one way ANOVA (A,B and D) and by two-tailed paired t-test (E–I), respectively.