
Figure 5.
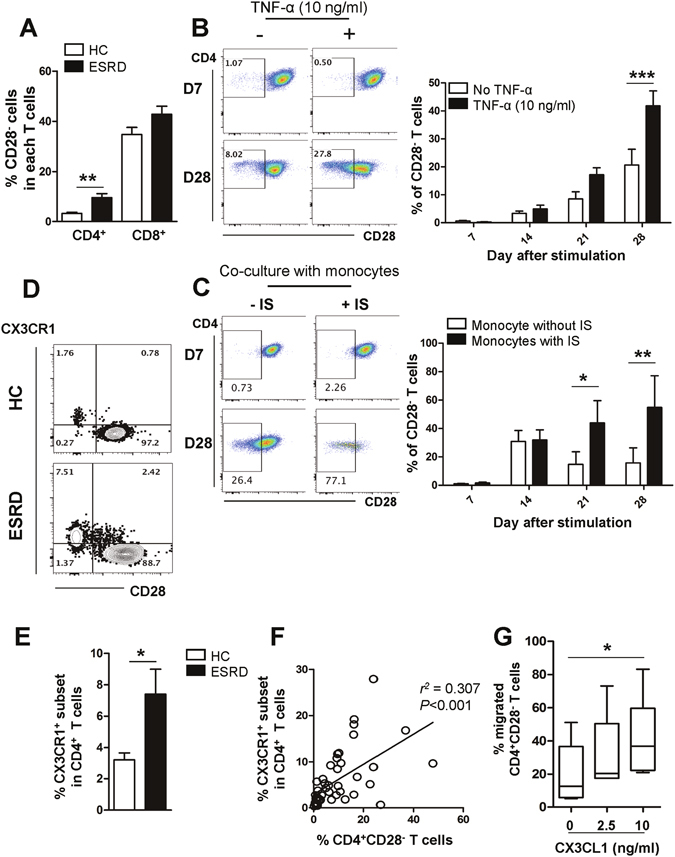
CD4+CD28− T cells expressing CX3CR1, a receptor for CX3CL1, are expanded under the TNF-α rich environment in ESRD patients. (A) Frequencies (%) of CD28− cells in CD4+ and CD8+ T cells in ESRD patients (n = 50) and age-matched HCs (n = 28). (B) Purified CD4+CD28+ cells from ESRD patients were stimulated with α-CD3/CD28 Ab-coated beads and IL-2 in the absence or presence of TNF-α. At 4 days, beads were removed using a magnet and the cytokines were re-supplemented every 3–4 days. CD28 expression was analyzed every 7 days by flow cytometry. Representative FACS plot of change in CD28 expression on cultured CD4+CD28+ T cells in ESRD patients under indicated culture conditions (Left). On the indicated day, cultured cells were harvested and the frequency of CD28− cells was determined by flow cytometry (n = 4) (Right). (C) Purified naive CD4+ T cells were stimulated with α-CD3/CD28 Ab-coated beads and IL-2. At 4 days, beads were removed using a magnet and the cell were co-cultured with monocytes, which were stimulated with IS (1,000 μM) for 24 hr. IS-stimulated CD14+ monocytes were re-supplemented every 3–4 days. CD28 expression was analyzed every 7 days by flow cytometry. Representative FACS plot of change in CD28 expression on cultured naive CD4+ T cells under indicated culture conditions (Left). On the indicated day, cultured cells were harvested and the frequency of CD28− cells was determined by flow cytometry (n = 3) (Right). (D) Representative contour plot of CX3CR1 expression on CD4+CD28+ and CD4+CD28− T cells from ESRD patients and HCs (E) Expanded CX3CR1+CD4+ T cells in patients with ESRD compared with HCs. (F) Frequency (%) of CX3CR1+ cells positively correlates with the frequency of CD28− cells in CD4+ T cells of ESRD patients (n = 46). Each data point represents an individual subject. (G) Freshly-purified CD4+ memory T cells from ESRD patients were stained with APC-conjugated anti-CD28 mAb and a chemotaxis assay was performed at various concentrations of CX3CL1 (0 to 10 ng/ml) for 2 hours using a transwell system. The frequency (%) of CD28− T cells in migrated cells at various concentrations of CX3CL1 was analyzed by flow cytometry. Bar graphs show the mean ± SEM. *p < 0.05, **p < 0.01, and ***p < 0.005 by two-tailed unpaired t-test (A and E) or 2 way ANOVA test (B and C). P value in (F) was obtained using the Pearson correlation analysis. Box plots displaying medians, 25th and 75th percentiles as boxes, and minimum and maximum values as whiskers (n = 6). *p < 0.05 by two-tailed paired non-parametric test (G).