
Figure 6.
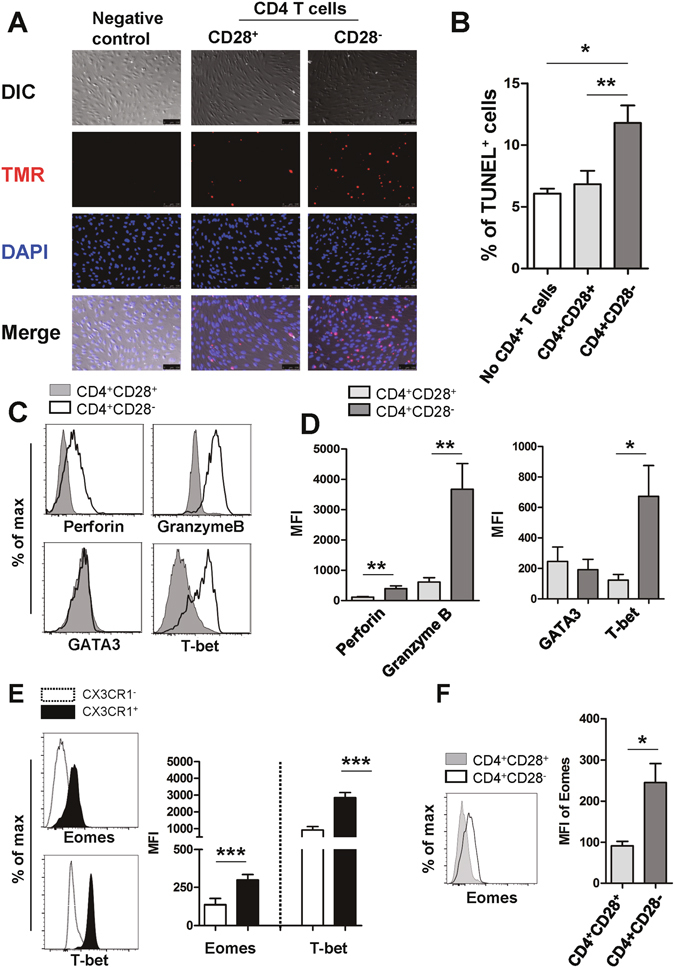
CD4+CD28− T cells have features typical of cytotoxic T cells and induce death in HUVECs in response to TCR stimulation. (A) Activated CD4+CD28− T cells induce death of HUVECs. HUVECs were pre-treated with IFN-γ (2,000 U/ml) for 48 hours and co-cultured with purified CD4+CD28− T cells or CD4+CD28+ T cells in the presence of superantigen, SEB (10 ng/ml), and TSST-1 (10 ng/ml) for TCR stimulation. The level of cell death was analyzed by TUNEL assay. The nuclei in TUNEL+ apoptotic cells were detected by TMR (red) and DAPI (blue) was used for nuclei staining of HUVECs. Data is representative of four independent experiments. At least three images were analyzed in each group. Scale bar equals 100 μm. (B) Frequencies (%) of apoptotic cells among three treatment groups. (C) Representative histogram plot of cytotoxic granules (perforin and granzyme B) and transcription factors (GATA3 and T-bet) in CD4+CD28+ and CD4+CD28− T cells from ESRD patients. (D) MFIs (mean fluorescent intensities) of cytotoxic granules and transcription factors were compared between CD4+CD28+ and CD4+CD28− T cells (n = 11) (E) Representative histogram plot (Left panel) and MFIs (Right panel) of transcription factors, Eomes and T-bet in CX3CR1+ and CX3CR1− CD4+ T cells from ESRD patients (n = 5). (F) Representative histogram plot (Left panel) and MFIs (Right panel) of Eomes in CD4+CD28+ and CD4+CD28− T cells from ESRD patients (n = 5). *p < 0.05, **p < 0.01 and ***p < 0.005 by two-tailed paired t-test.