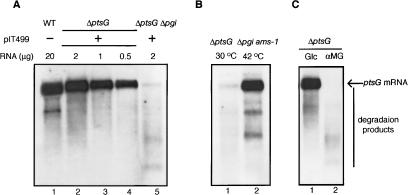
Figure 2.
Expression and response to phosphosugar stress of plasmid-borne ptsG. (A) IT1568 (wild-type) (lane 1), AS16 (ΔptsG) harboring the ptsG plasmid pIT499 (lanes 2-4), and AS18 (ΔptsG Δpgi) harboring pIT499 (lane 5) were grown to A600 = 0.5. Glucose was added at a final concentration of 1% and incubation was continued for 20 min. Total RNAs were prepared, and indicated amounts of RNA samples were subjected to Northern blot analysis using the ptsG probe. (B) AS20 (ΔptsG Δpgi ams-1) harboring pIT499 was grown at 30°C to A600 = 0.5. Glucose was added at a final concentration of 1%, and incubation was continued at the indicated temperature for 20 min. Total RNAs were prepared and 2 μg of RNA samples was subjected to Northern blot analysis using the ptsG probe. (C) AS16 harboring pIT499 was grown to A600 = 0.5. Glucose (Glc) or α-methylglucoside (αMG) was added at a final concentration of 1%, and incubation was continued for 20 min. Total RNAs were prepared and 2 μg of RNA samples was subjected to Northern blot analysis using the ptsG probe.

