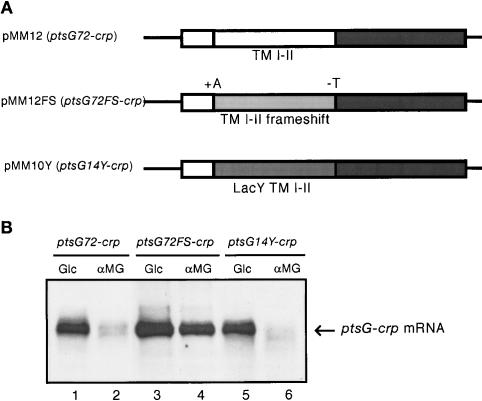
Figure 6.
Expression and response to phosphosugar stress of ptsG-crp translational fusion variants. (A) Schematic representation of altered ptsG-crp translational fusions. The rectangles in white and black represent the ptsG and crp coding regions, respectively. The rectangles in light and dark gray represent TM I-II of IICBGlc with frameshift mutations and LacY TM I-II, respectively. The frameshift mutations just before and after TM I-II are shown as +A (insertion) and -T (deletion) in the ptsG72FS-crp gene. (B) Northern blot analysis of altered ptsG-crp mRNAs. IT1568 harboring pMM12 (lanes 1,2), pMM12FS (lanes 3,4), or pMM10Y (lanes 5,6) was grown to A600 = 0.5. Glc or αMG was added at a final concentration of 1%, and incubation was continued for 20 min. Total RNAs were prepared and 3 μg (lanes 1,2,5,6) or 1 μg (lanes 3,4) of RNA samples was subjected to Northern blot analysis using the crp probe.

