Figure 3.

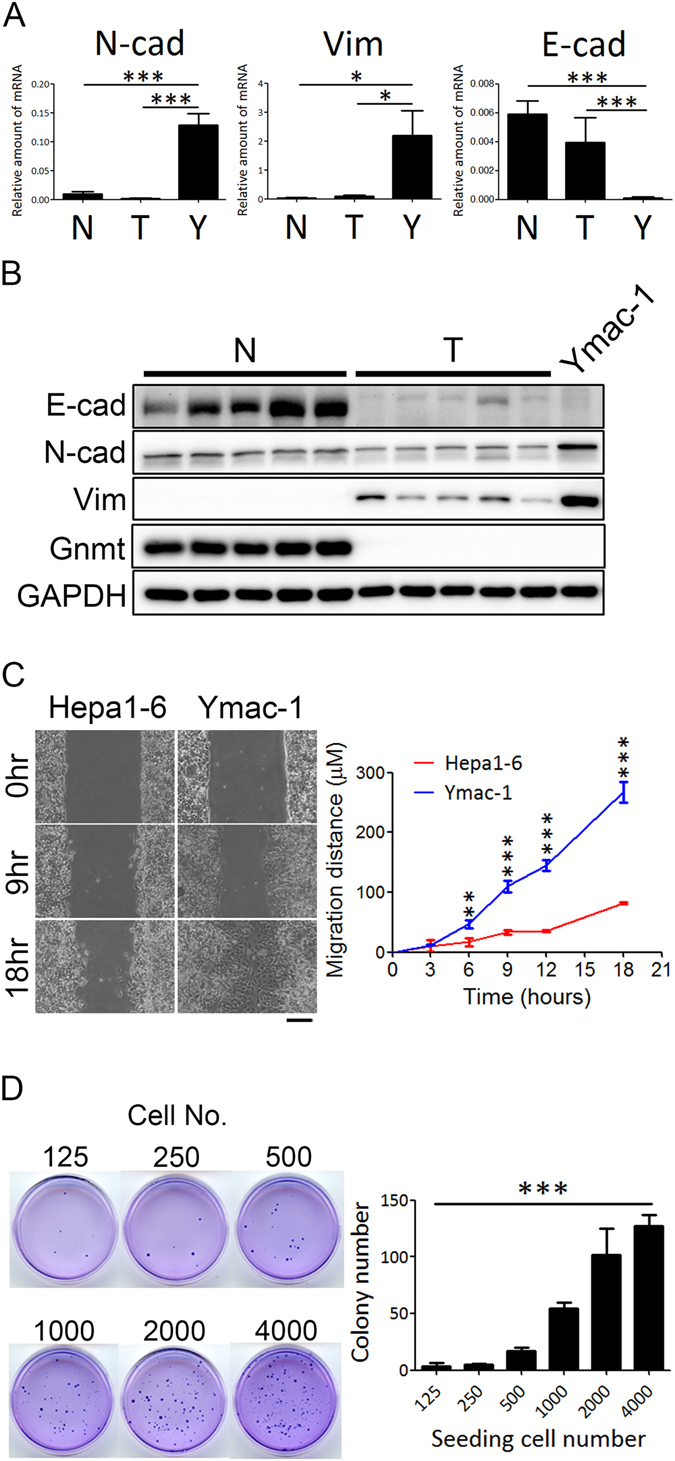
Ymac-1 cell displays characteristics consistent with EMT. (A) Determination of N-cadherein (N-cad), E-cadherin (E-cad), Vimentin (Vim) mRNA expression in normal liver (N, n = 3), HCC tissues from Gnmt−/− mice (T, n = 4) and Ymac-1 cells (Y). Data is presented as mean ± s.d. *P < 0.05 and ***P < 0.001, using Student’s t-test. (B) Western blot of analyses of N-cad, Vim, and E-cad in normal liver (N, n = 4), HCC tissues from Gnmt−/− mice (T, n = 4) and Ymac-1 cells. (C) Representative picture and quantitative results of wound healing assay of Ymac-1 and Hepa1-6 cells. Bar: 100 μm. Data is presented as mean ± s.d. **P < 0.01, ***P < 0.001, using repeated measures ANOVA analysis with a Bonferroni post hoc test. (D) Anchorage-independent growth of Ymac-1 cell. Right panel is the quantitative results. Data is presented as mean ± s.d. ***P < 0.001, significant linear trend over dose levels.
