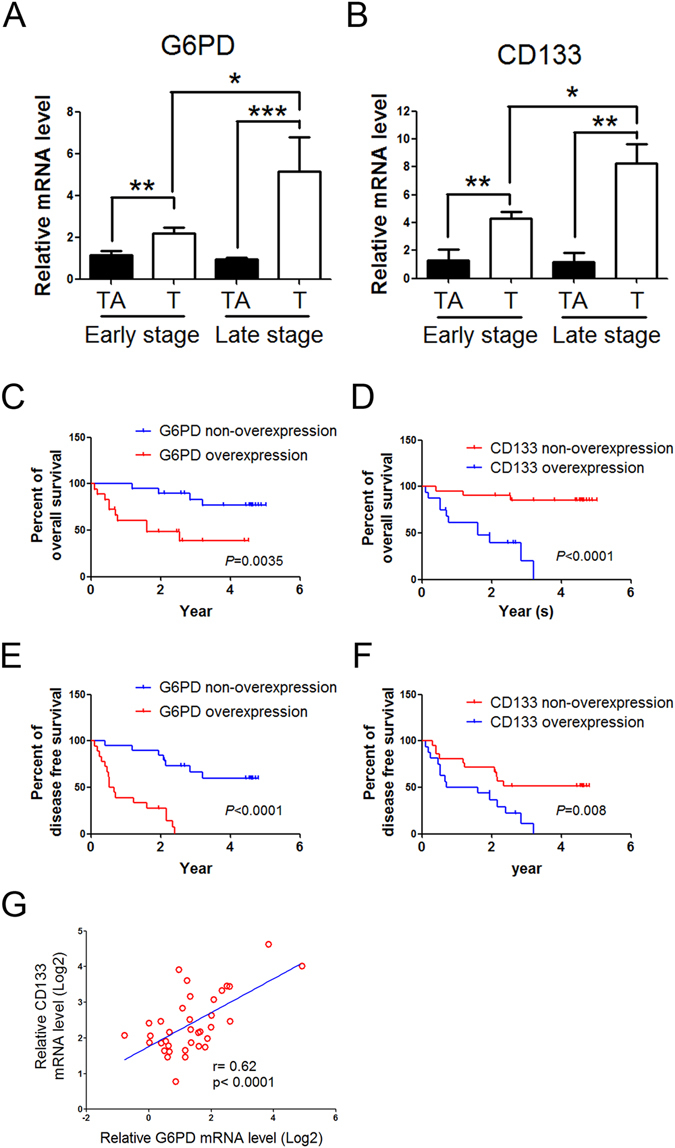
Figure 7.

The positive correlation between G6PD and CD133 expression levels in HCC patients. (A,B) The expression of G6PD and CD133, respectively, in patients with HCC by real-time PCR. Data are presented as mean ± SEM. *P < 0.05, **P < 0.01 and ***P < 0.001, using Student’s t-test. (C–F) Kaplan-Meier analysis of overall survival (C and D) and disease-free survival (E and F) in 37 HCC patients with low or high G6PD (C and E) or CD133 (D and F) expression. The P values were calculated using the log rank test. (G) Pearson correlation analysis of G6PD and CD133 mRNA levels in tumor tissues.
