
Figure 2.
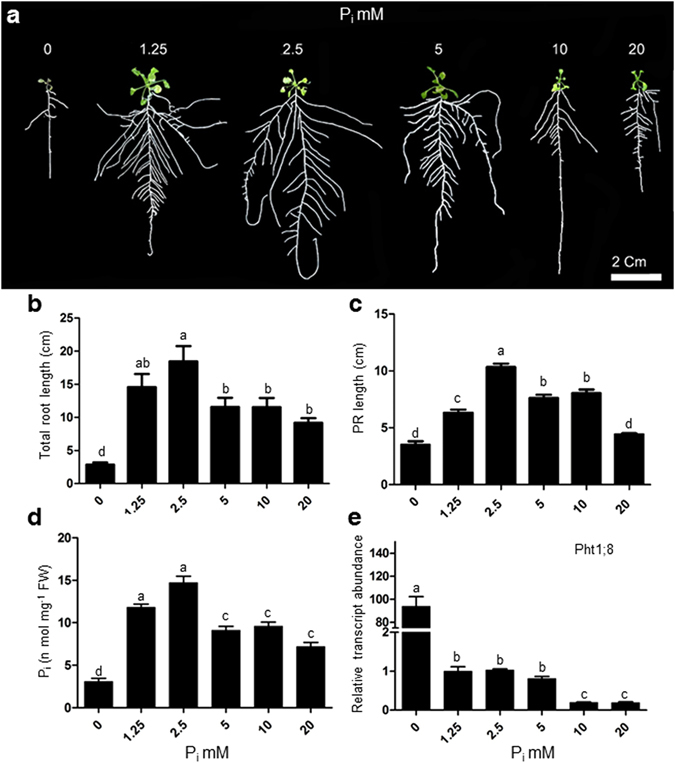
Supply of different concentrations of excess phosphate (Pi) modulates different morphophysiological parameters of root. WT seedlings were grown as described in the caption to Fig. 1. Data are presented for Total root length (b), Primary root length (c), total soluble Pi content (d), Expression level of Pht1;8 (e), Values are means ± SE, and n = 21 (b,c) or n = 3 consists of 20–50 mg root tissue in each assay (d). n = 3 consists of 50 mg root tissue for each replicate (e). Mean Bars with different alpha letter differ significantly (P ≤ 0.05) according to analysis of variance (1X-ANOVA) with Tukey’s Multiple Comparison Posttest.